GravityCharts
The GravityCharts add-on for Gravity Forms makes it visualize Gravity Forms data by creating charts and graphs.
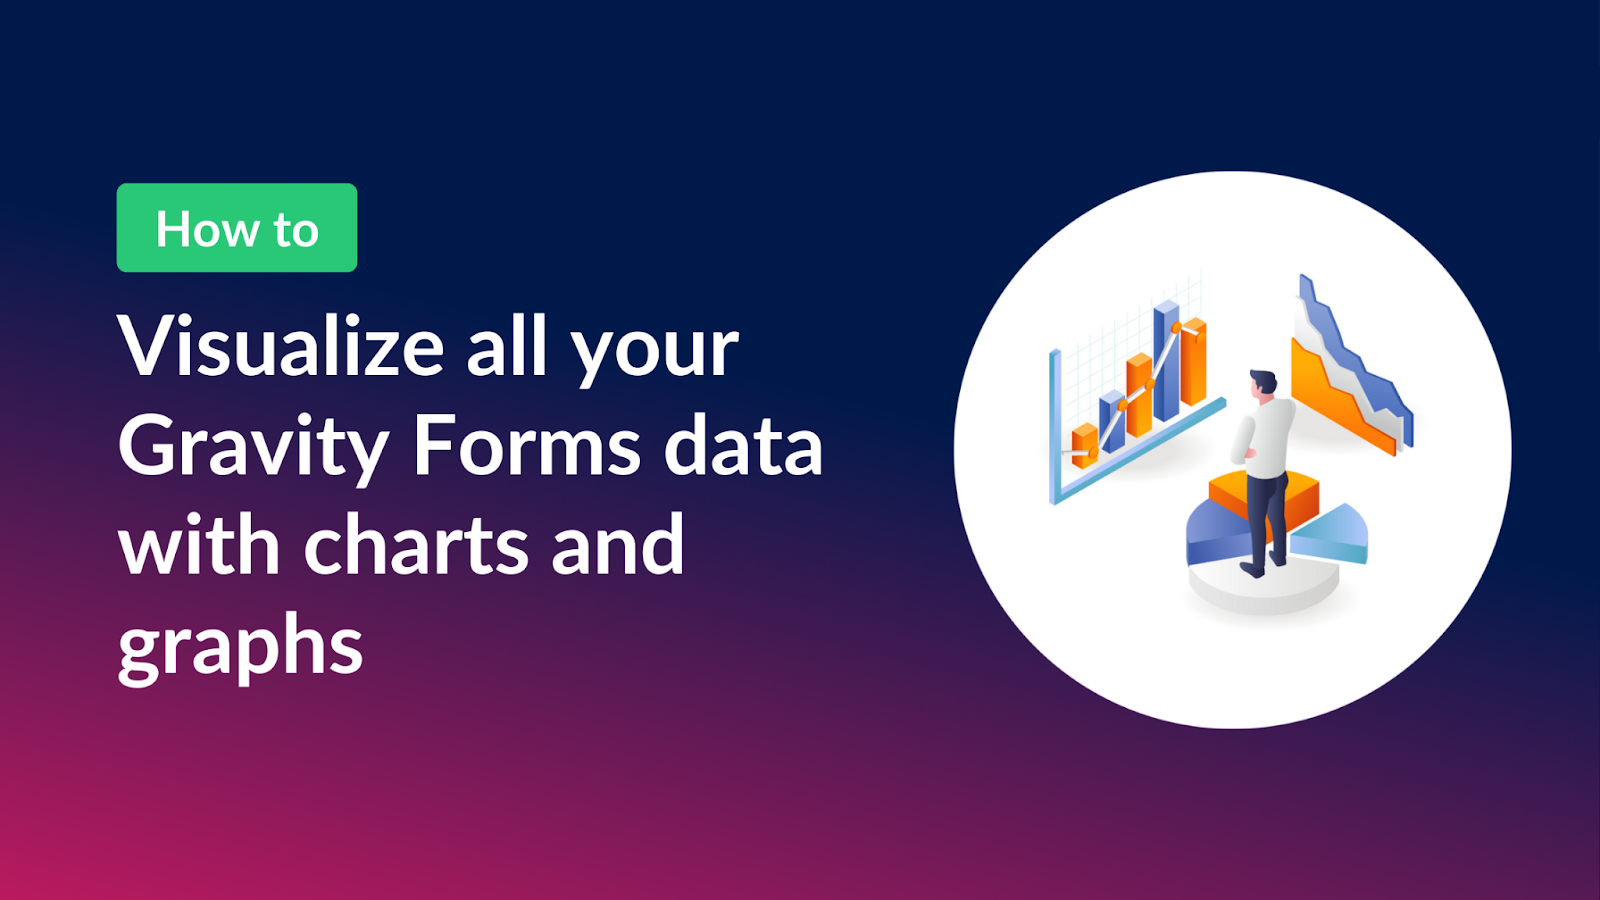
How to visualize your Gravity Forms data with charts and graphs
Turn Gravity Forms entry data into charts and graphs using the GravityCharts add-on. Supports bar charts, line charts, radar charts, and more for dashboards and reports.
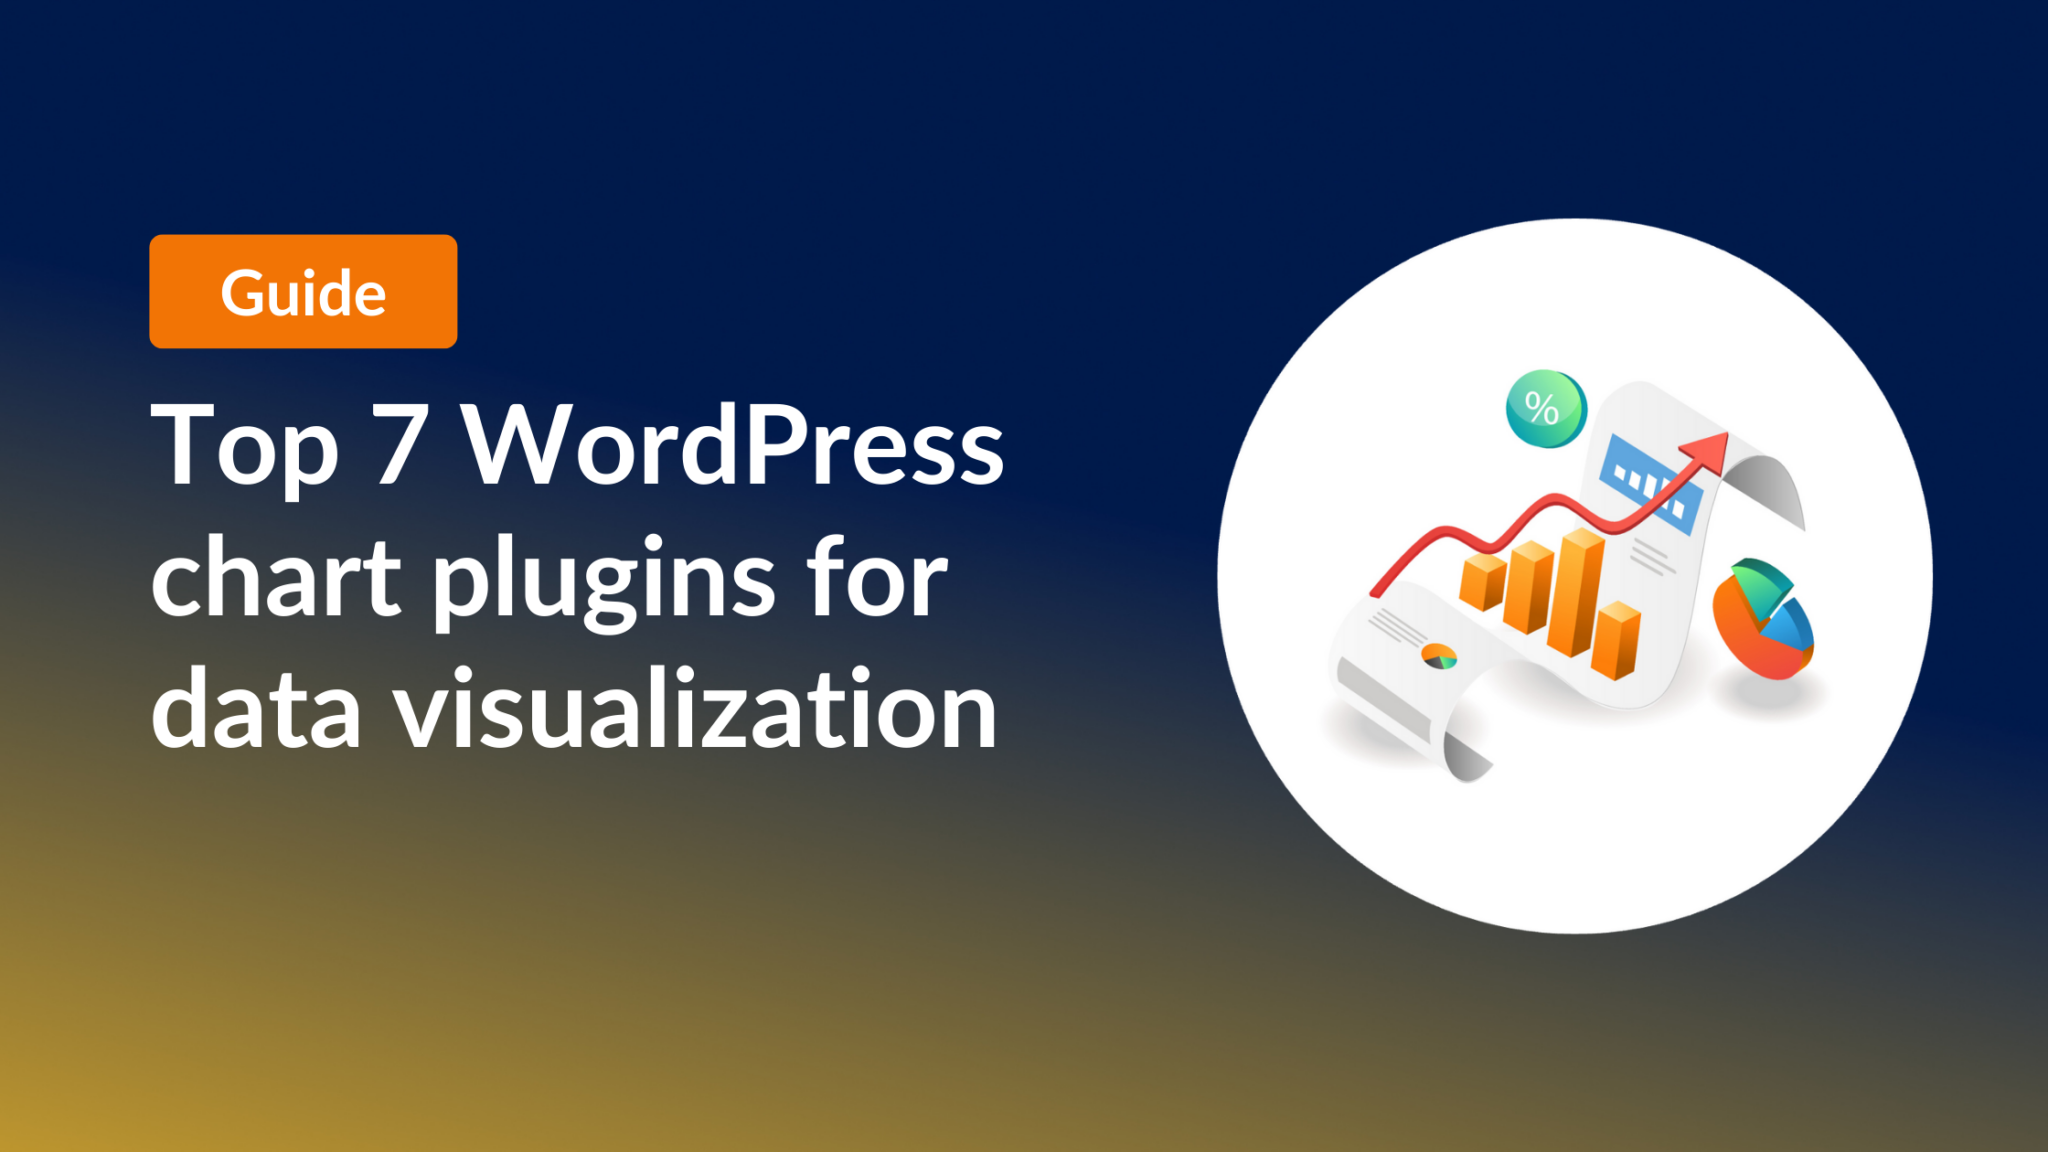
Top 7 best WordPress chart plugins for data visualization
Compare the 7 best WordPress chart plugins for data visualization. Detailed reviews of GravityCharts, Visualizer, Chartify, and more to help you choose the right tool.

Feature highlight: Plotting data against time using GravityCharts
GravityCharts supports plotting Gravity Forms data against time for trend analysis and timeline charts. Visualize how submission data changes over days, weeks, months, or years.

How to build a WordPress business intelligence dashboard
Build a WordPress business intelligence dashboard using Gravity Forms, GravityCharts, and GravityView. Visualize form data, track KPIs, and make better decisions without expensive BI tools.
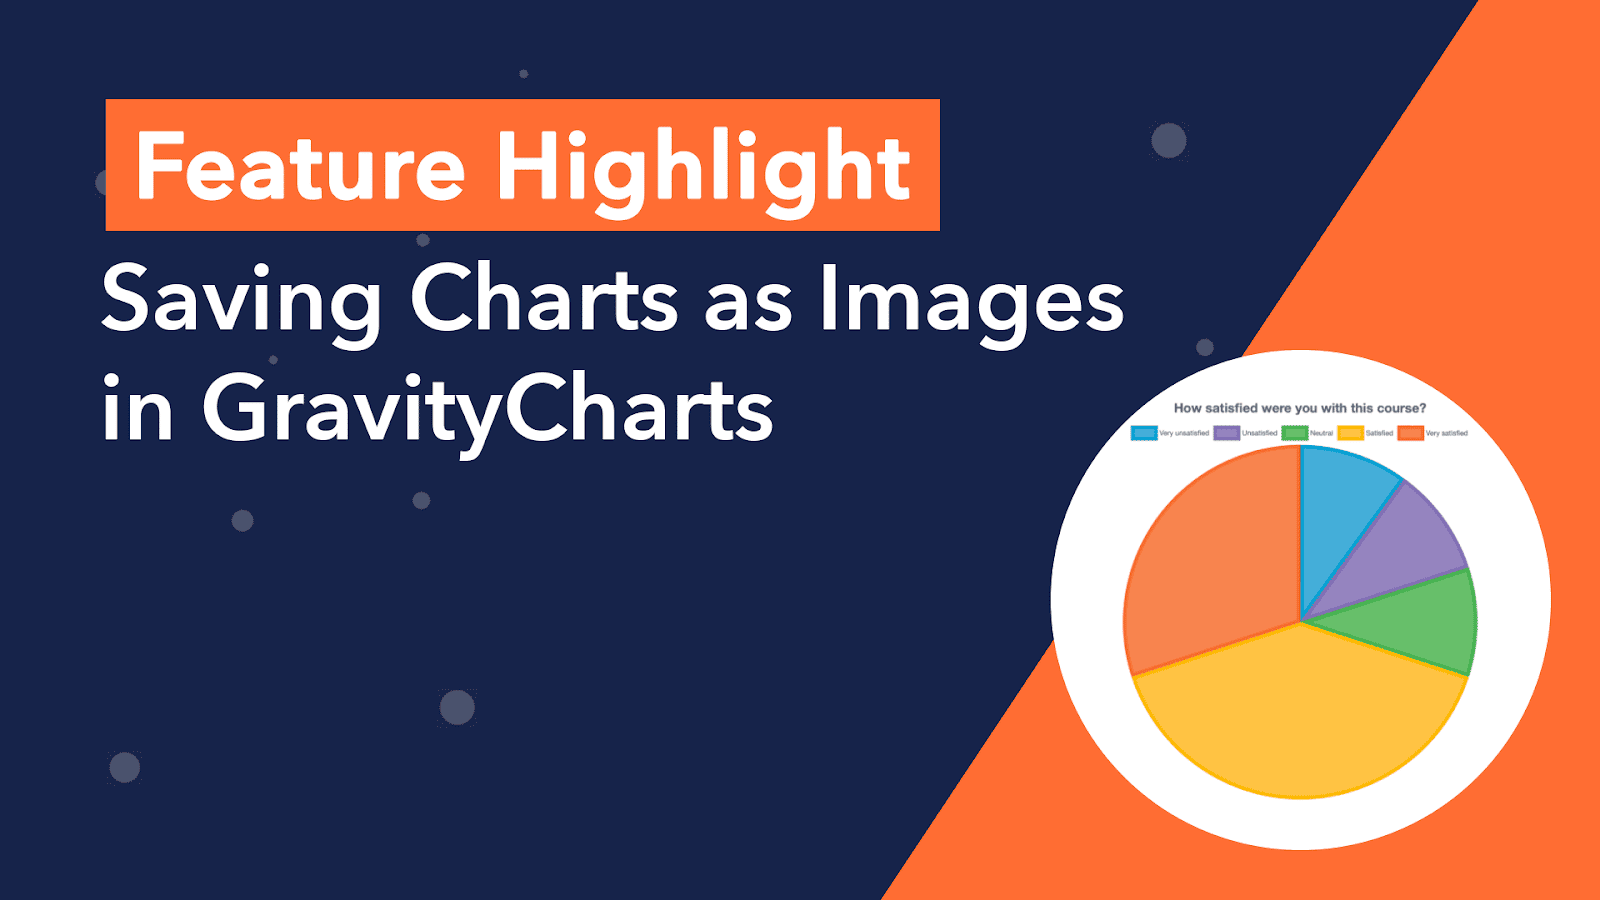
Feature Highlight: Saving Charts as Images in GravityCharts
Save GravityCharts visualizations as image files to embed in email notifications or PDF reports. Covers the Image Charts beta feature and how to build versatile data reports.
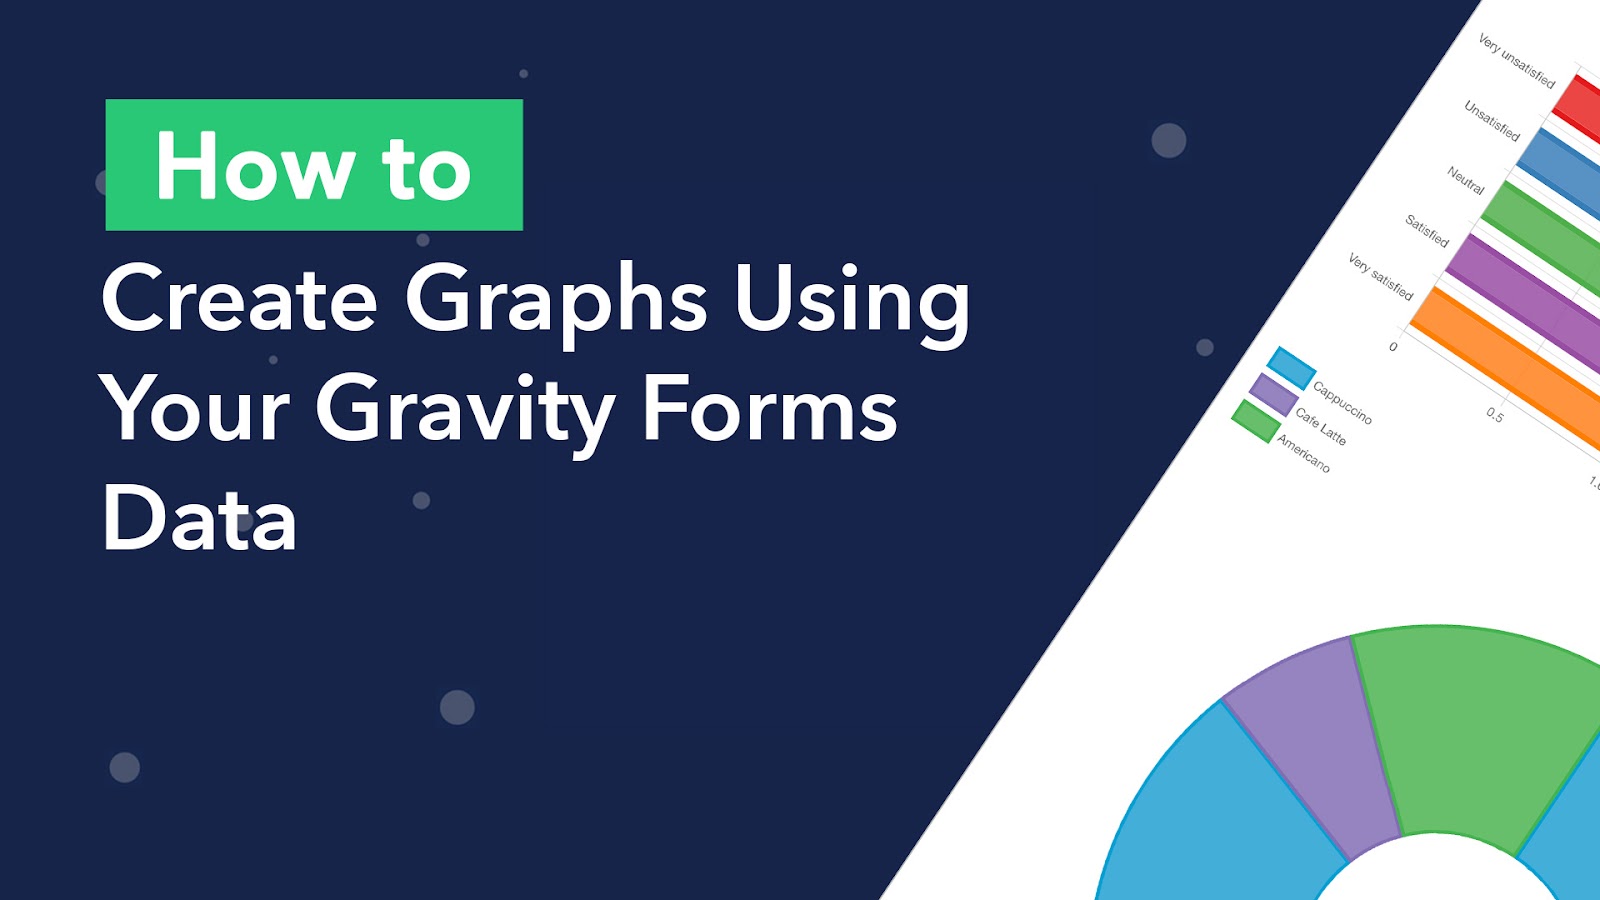
How to Create Graphs in Gravity Forms Using Your Form Data
Today, businesses rely on graphs in order to visualize large amounts of data in a meaningful way. Most people would agree that graphs are way more appealing than spreadsheets. And that’s not surprising, considering people engage more with visual content. In fact, the human…