Published
•
Updated
Top 7 best WordPress chart plugins for data visualization
Compare the 7 best WordPress chart plugins for data visualization. Detailed reviews of GravityCharts, Visualizer, Chartify, and more to help you choose the right tool.

I reviewed the most popular WordPress chart plugins to help you decide which one is the best fit for your website.
Using charts and graphs is one of the best ways to communicate insights from data analysis. Data visualization also helps to communicate complex information in an easy-to-understand manner. With the help of visuals, it’s easier to interpret and understand large amounts of data quickly.
If you’re looking for a chart plugin for your website or an upcoming project, keep reading!
Why create charts and graphs on WordPress?
WordPress is an excellent platform for creating and sharing charts and graphs. With the help of plugins, you can easily create interactive charts, graphs, and tables to display your data in an organized manner.
Not only do these visuals make it easier for readers to understand the data, but they also add a touch of professionalism to your website!
Moreover, creating charts and graphs on WordPress is incredibly simple—if you have the right tools. With just a few clicks, you can transform complex numbers into visually appealing graphics that are easy to interpret. This makes it easier for readers to gain insights from your data without having to read through long blocks of text.
Now let’s take a look at the top 7 best chart plugins for WordPress…
1. GravityCharts
GravityCharts is an add-on for Gravity Forms that allows you to create beautiful charts and graphs using your Gravity Forms data.
After installing GravityCharts, you’ll be able to create visualizations using the data you collect through your forms. You can display your data using different types of charts, including line charts, pie charts, bar charts and more!
Gravity Forms is the most powerful WordPress form builder. With Gravity Forms, you can create survey forms, sign-up forms, eCommerce forms—anything!
Gravity Forms and GravityCharts are the perfect tools for data collection and visualization on WordPress. Using this combination, you can build data dashboards, create business reports, visualize questionnaire results, and more.
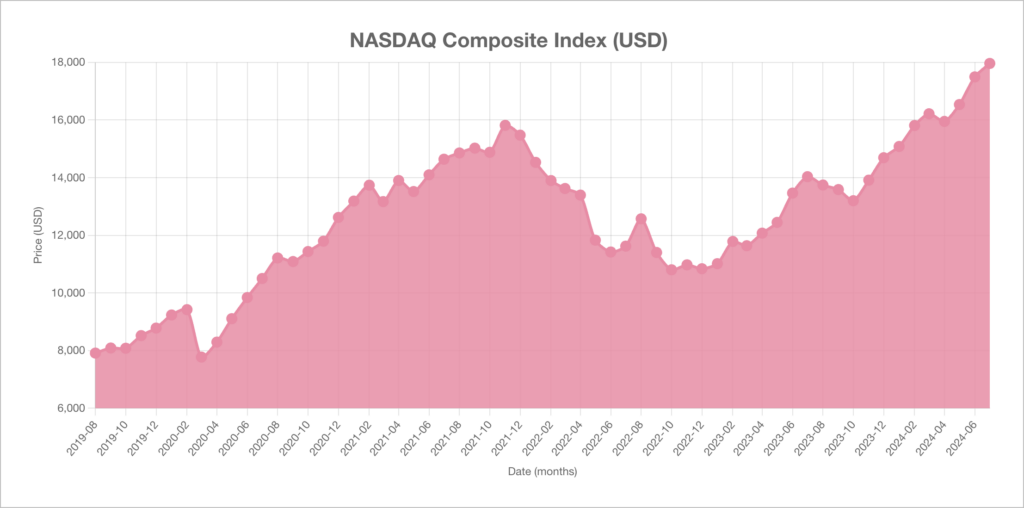
GravityCharts includes a modern user interface, with extensive styling options for creating charts with the look and feel you want. After creating a chart, you can embed it on a page/post using a shortcode or block. GravityCharts is powered by Chart js, a popular open-source chart library.
Is there a live demo?
Yes! You can see what GravityCharts visualizations look like on the front end, or get your own free demo site to test out the plugin!
Key features:
- There are 5 chart types to choose from
- Charts are easy to style (no code required)
- Live preview that updates as you make changes
- Charts update in real-time as your form receives new data
- Can embed charts as images
- Integrates with the Gutenberg block editor
Pricing:
GravityCharts starts at $99 (requires Gravity Forms).
Wanna try it?
Spin up a demo
See GravityCharts in action on its live demo site.

2. Visualizer
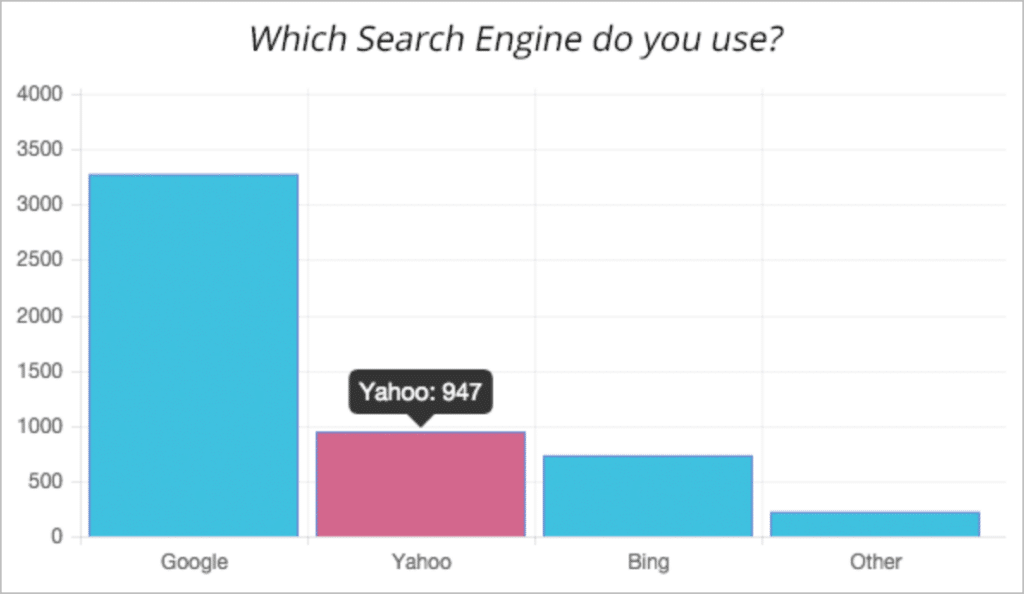
Visualizer is a popular data visualization plugin for WordPress that allows you to visualize data using charts or tables. The plugin is specifically designed for users who want an easy way to embed interactive charts on their WordPress site.
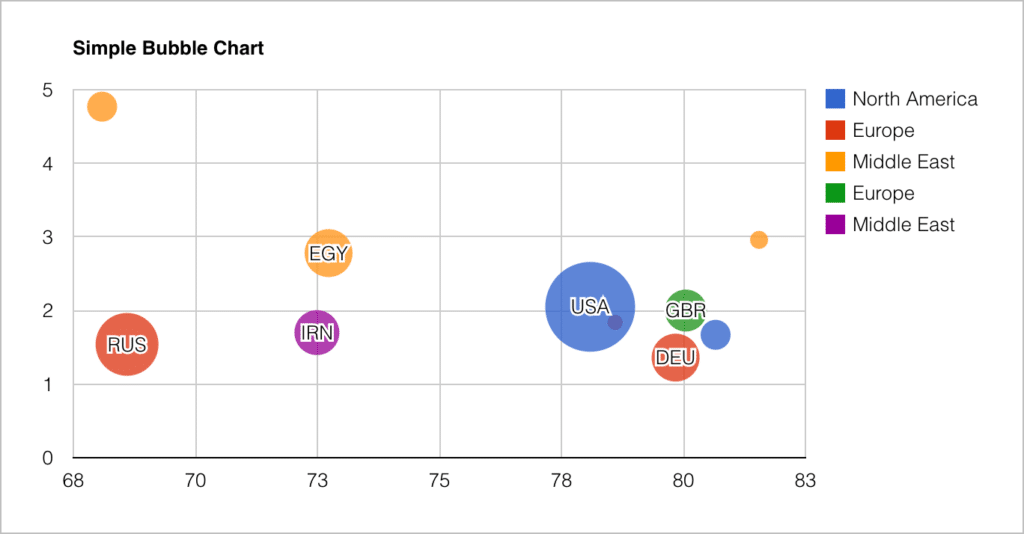
The benefit of Visualizer is that you can draw data from a variety of sources, including Google Sheets, Excel, or an external API. The plugin also supports 15 chart types in the pro version, allowing you to visualize data in a multitude of ways.
As you can see from the above image, the charts that Visualizer creates aren’t the most modern-looking. The charts are not the most flashy from a design perspective! However, if design isn’t a top priority for you, Visualizer is a solid choice for adding data visualizations to your WordPress website.
Is there a live demo?
Yes. The Visualizer demo site allows you to preview all 15 chart types in the Pro version.
Key features:
- Supports 15 chart types in the Pro version
- Allows you to add data from a variety of sources
- Charts are all responsive
Pricing:
There is a free version available on WordPress.org. The Pro version starts at $99.
3. Chartify
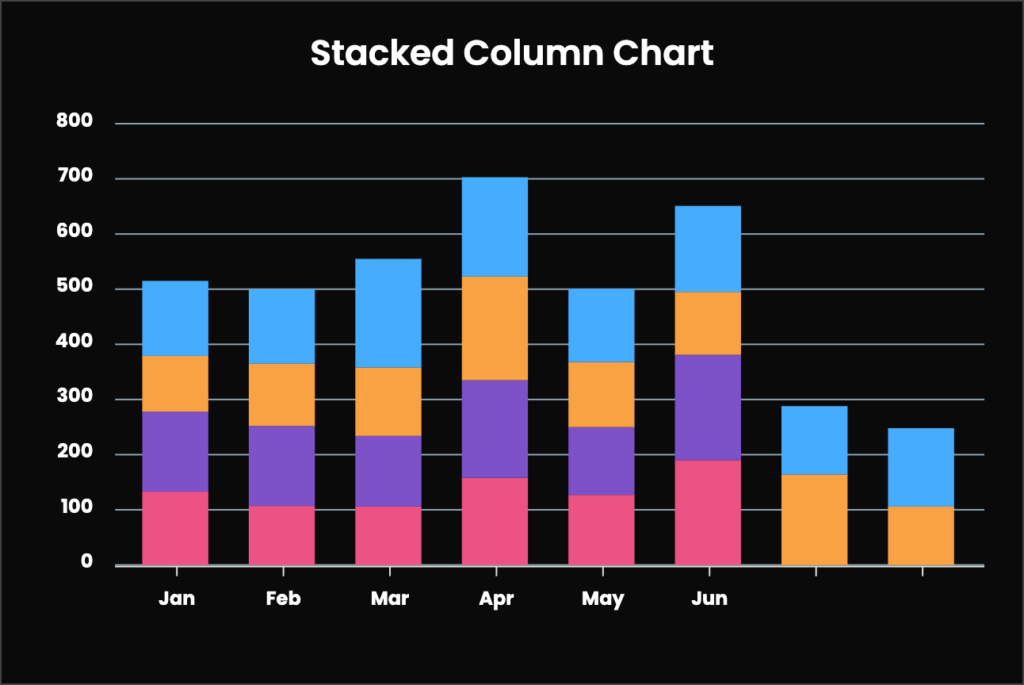
Chartify is a freemium WordPress plugin that enables you to display charts on your site using three different methods: You can manually input the chart data, link a chart to a Google Spreadsheet, or query data from your database.
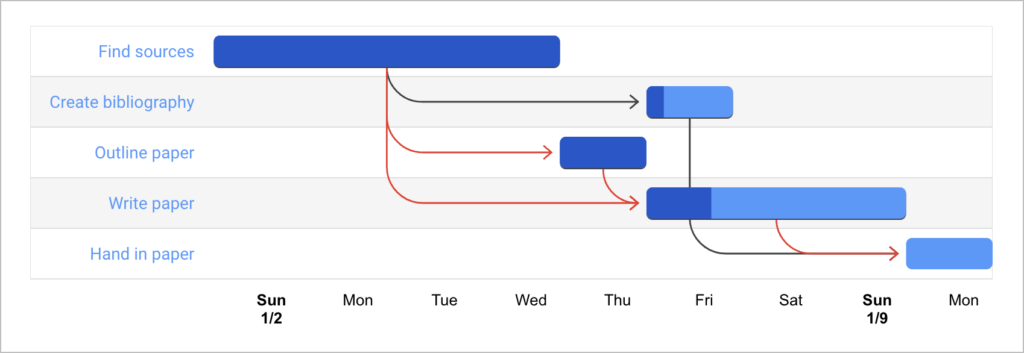
The Chartify plugin uses Google charts under the hood. While Chartify offers access to a broad range of chart types, including organizational charts and gantt charts, the trade-off is that the charts don’t look particularly attractive. However, if you’re more concerned with functionality over aesthetics, this could be a good plugin to consider.
Is there a live demo?
Yes, the Chartify demo allows you to see what the charts look like on the front end.
Key features:
- Supports a broad range of chart type (including organizational charts)
- Link your charts to a Google Spreadsheet so they update automatically
- Generous free version
- Embed charts using a shortcode
Pricing:
The basic plugin is free, with the premium option starting at $45 (one time payment).
4. M Chart
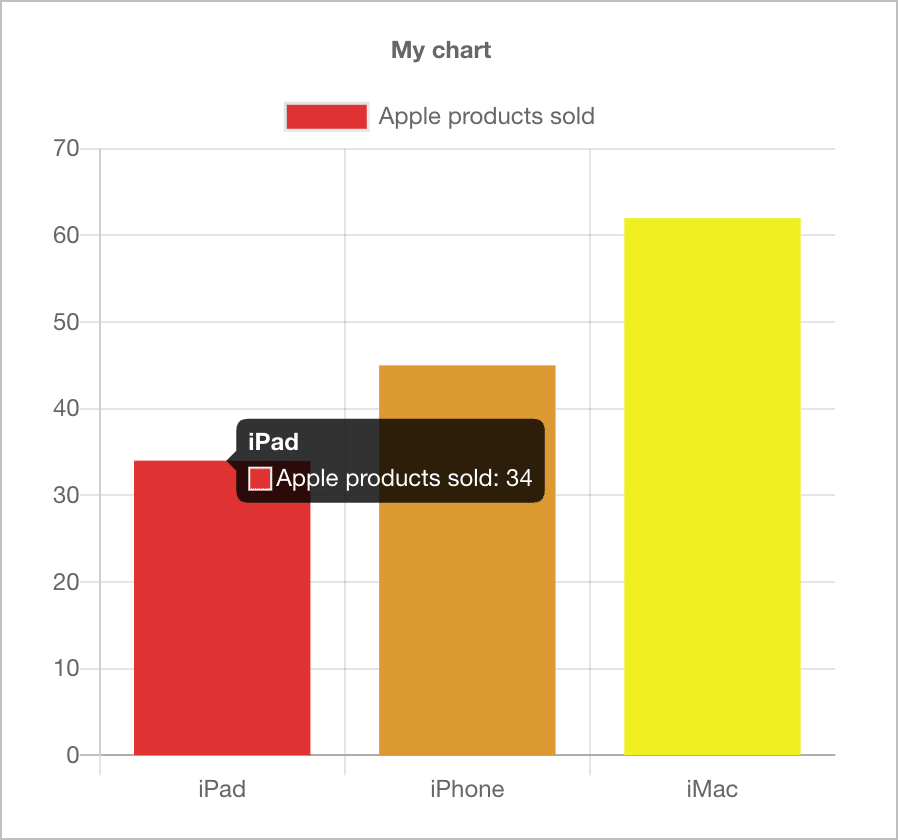
M Chart is a free WordPress chart plugin that allows you to input data via a spreadsheet and display different chart types on the front end.
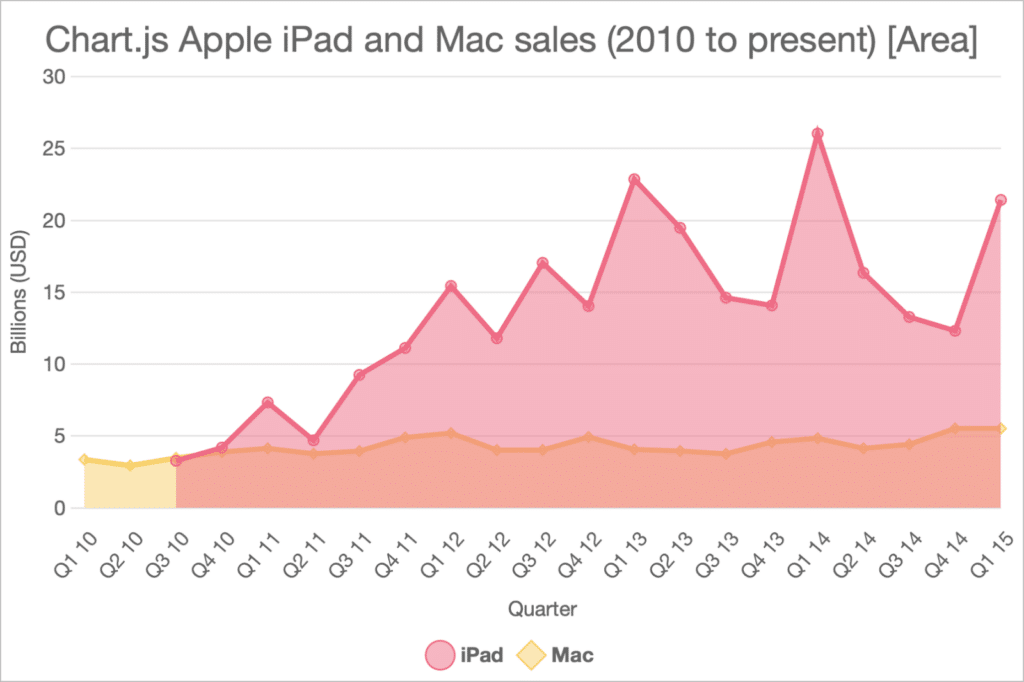
M Chart support bar charts, line charts, scatter plots, pie charts, radar charts, and polar area charts. You can also generate images of the charts you create. The plugin is useful if all you’re looking to do is display some basic visualizations. However, there are limited options for styling and customization.
Is there a live demo?
No. M Chart does not have a live demo.
Key features:
- Enter your data via a spreadsheet interface
- Supports both the Highcharts and Chart.js libraries
- Embed charts via shortcode
Pricing:
The plugin is free on WordPress.org.
5. WP Charts and Graphs
The WP Charts and Graphs plugin allows you to generate charts from your WordPress Admin, which you can embed on your site using a shortcode.
When creating a chart, you specify the titles and the values, and choose the chart type. The plugin will then automatically generate the shortcode which you can include on any page or post!
WP Charts and Graphs may be helpful for adding simple data visualizations to your website, but there are very few options for additional customization. Moreover, you can’t pull data from an external source, so you’ll need to manually enter the values when creating the chart.
Is there a live demo?
No. WP Charts and Graphs does not have a live demo.
Key features
- Live preview
- Responsive
- Multiple chart types to choose from
Pricing:
The plugin is free to download from WordPress.org, with an upgraded version available for $44.
6. Graphina – Elementor Charts and Graphs
Graphina allows you to easily create charts and graphs on your WordPress website. You’ll need to have Elementor (a popular page builder) installed before you can use Graphina.
While there is a free version of the plugin available on WordPress.org, the Pro version includes a lot more features.
With the Pro version you can pull data from a range of data sources, including Google Sheets, external APIs, Firebase and more. It also includes over 15 chart types, such as line charts, radar charts, and scatter plots.
When adding a new chart, all you need to do is add your data points, adjust the grid display, and customize the styles. All of this can be configured directly from the Elementor interface.
Graphina is a powerful plugin with a range of customization options and chart types. However, the plugin requires you to have Elementor installed on your website. If you don’t use Elementor, you may consider using a different WordPress chart plugin.
Is there a live demo?
Yes. The Graphina demo includes a live demo of each chart type.
Key features:
- More than 15 different chart types
- Pro version includes support for multiple data sources
- Pro version includes dynamic charts that update in real-time
Pricing:
There is a free version available on WordPress.org, with the pro version costing $34.
7. iChart – Easy Charts and Graphs
iChart is a free WordPress chart plugin that allows you to add responsive graphs to your website. iChart supports creating pie charts, bar charts, line Charts, polar area charts, radar charts, and doughnut charts.
iCharts allows you to create charts directly from a WordPress page or post. All you need to do is add the iChart block and configure the options. The plugin will then generate a unique shortcode for you.
With iChart, you can’t use data from external data sources, and there are limited options when it comes to design. However, the Pro version gives you more flexibility by adding a host of new options like typography settings and support for multiple datasets.
Is there a live demo?
Yes. iChart does have a live demo, but some charts don’t seem to be working properly.
Key features:
- The Pro version includes a range of options for styling and customizing your charts
- The Pro version allows you to import/export chart data
Pricing:
There is a free version available on WordPress.org, with a pro version starting at $19.
Final thoughts on the best WordPress chart plugins
WordPress is an excellent platform for creating and sharing charts and graphs. With the help of plugins, you can easily create interactive charts, graphs, and tables to display your data in an organized manner!
In this post, I reviewed the top 7 best WordPress chart plugins. While the best plugin for you will depend on the unique needs of your project, check out GravityCharts if you need to visualize data collected from a form! You can view our live demos here and try out the plugin for free.

Helpful tips right in your inbox.
Subscribe to get the latest articles, information on releases and helpful Gravity Forms tips!
More articles

10 things you can ask AI to do with Gravity Forms (using the free GravityKit MCP)
See 10 practical things you can ask AI to do with Gravity Forms using the free GravityKit MCP: create forms, manage entries, build Views, and more.

Launch Log: theme template editing in Block MCP, Shield silentCAPTCHA for Zero Spam, and GravityView fixes
Block MCP adds safe theme template editing, Gravity Forms Zero Spam gains Shield silentCAPTCHA support, and GravityView fixes lightbox and notice bugs.

GravityKit turns 12: a year in review, and 30% off Lifetime All Access
GravityKit turns 12. A look back at a year of GravityView 3.0, GravitySearch, and AI-assisted building, plus a birthday sale on the Lifetime All Access Pass.