Published
•
Updated
Feature Highlight: Saving Charts as Images in GravityCharts
Save GravityCharts visualizations as image files to embed in email notifications or PDF reports. Covers the Image Charts beta feature and how to build versatile data reports.
In this edition of Feature Highlights, we’re exploring the new Image Charts beta feature for our GravityCharts add-on. This new feature allows you to save your charts as images for embedding into notification emails or PDF reports.
This adds another dimension to reporting and data analysis in Gravity Forms. Keep reading as we show you how to save new charts as image files and create versatile PDF reports!
Wanna try it?
Spin up a demo
See GravityCharts in action on its live demo site.

Creating charts in Gravity Forms using GravityCharts
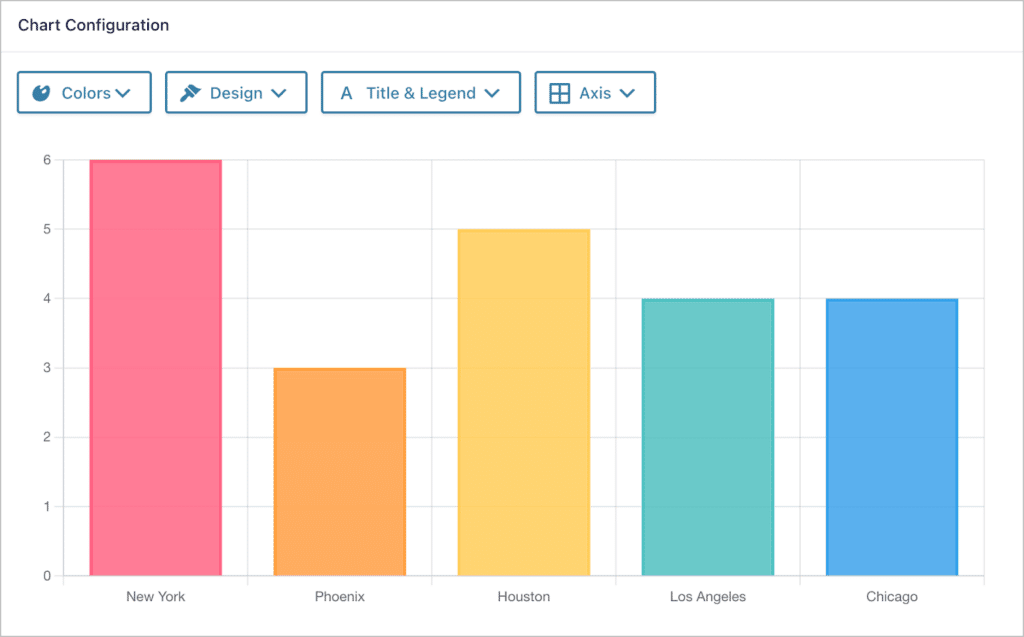
GravityCharts is an add-on for Gravity Forms that allows you to create charts and graphs using your form data. With GravityCharts you can build data dashboards, create business reports, visualize questionnaire results, and more!
Saving charts as images
Charts created using GravityCharts can be embedded anywhere on your WordPress website using the GravityCharts block or shortcode. However, by default, charts are output using JavaScript, meaning you need a browser to render them.
With the new image charts feature, you can save charts as PNG images, making it easy to embed them in notification emails, PDF reports or other documents external to your website.
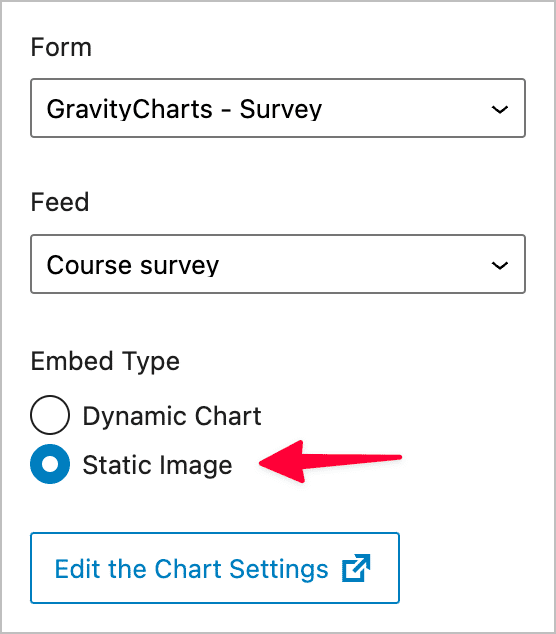
If you’re embedding your charts using the WordPress block, you can convert them to images by enabling the “Static Image” feature.
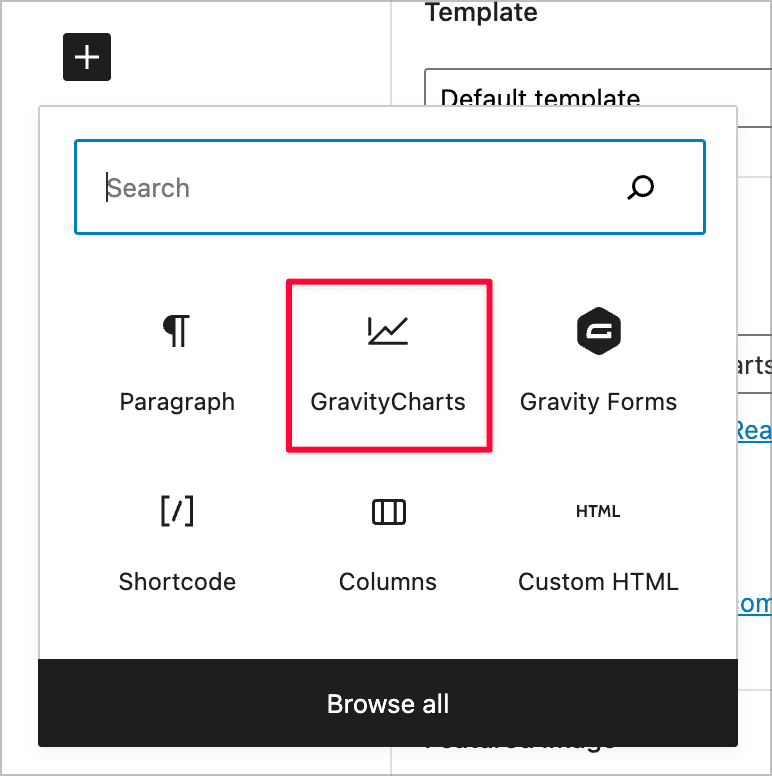
After adding the block to your page, open the block settings and change the embed type from “Dynamic Chart” to “Static Image”.
Your chart will now render as a PNG image that you can save to your computer.
Embedding image charts inside notification emails
You can also embed charts inside Gravity Forms notification emails using the {gravitycharts} merge tag. All you need to do is add the merge tag inside the email message box (just be sure to include the correct chart ID).
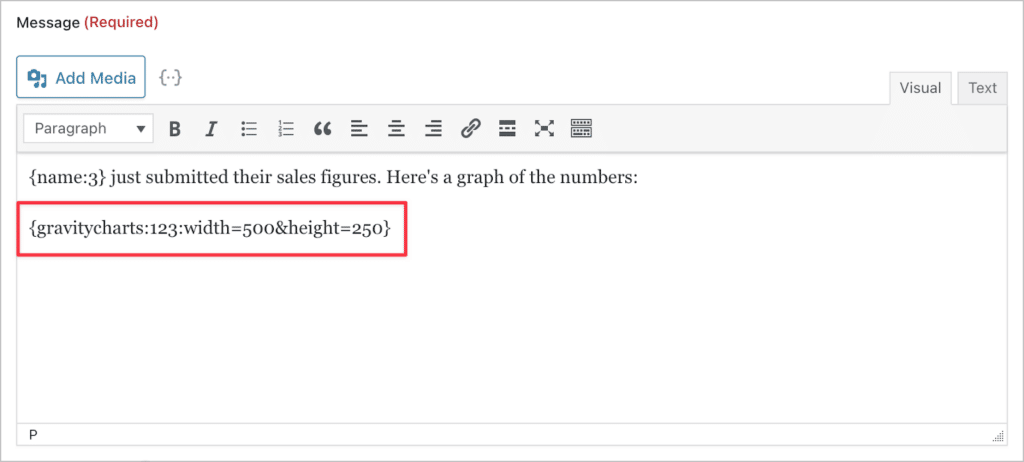
For more information about the GravityCharts merge tag, check out our documentation.
Embedding image charts in PDF reports
By saving your charts as images, you can also embed them into PDF reports generated using the Gravity PDF plugin.
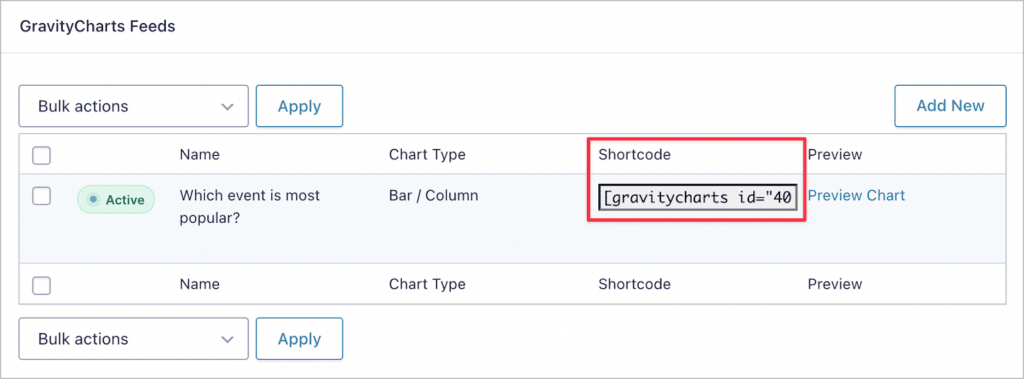
The first thing you’ll need to do is copy the shortcode for the specific chart that you want to embed. You’ll find the shortcode on the GravityCharts feed page.
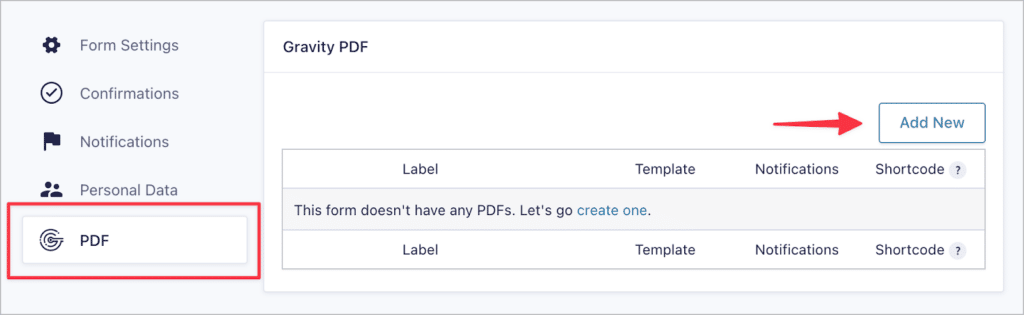
Now create a new PDF report. You can do this by going to the form settings, selecting the “PDF” option on the left and clicking “Add New”.
When configuring your new PDF, make sure to enable the “Show HTML Fields” option.
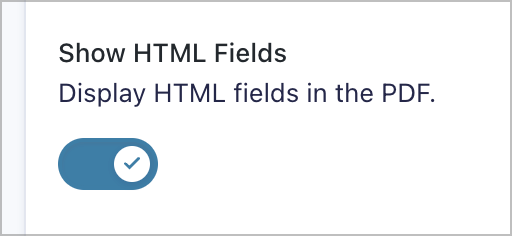
When you’re finished, save your new PDF feed.
Because Gravity PDF only displays data from the form entry itself, you’ll need to add your chart inside a Gravity Forms HTML field. To do this, edit your form and add a new HTML field type (you’ll find it under “Standard Fields”).
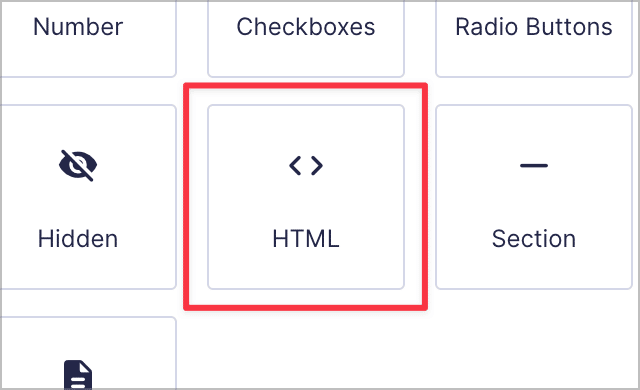
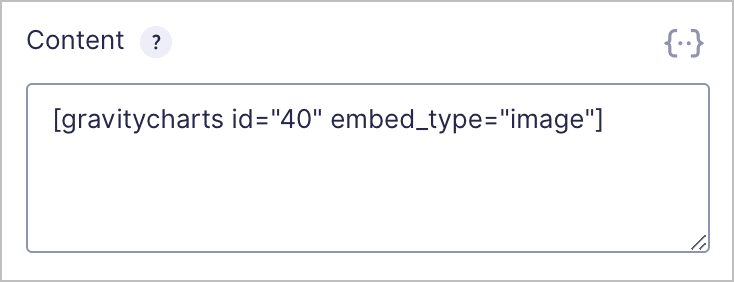
Now add your GravityCharts shortcode inside the Content box, being sure to include embed_type=“image”. This is very important! If you don’t include this, your chart won’t render properly.
Pro tipIf you only want your chart to show up on the PDF and not on the form itself, set the visibility to “Administrative”.
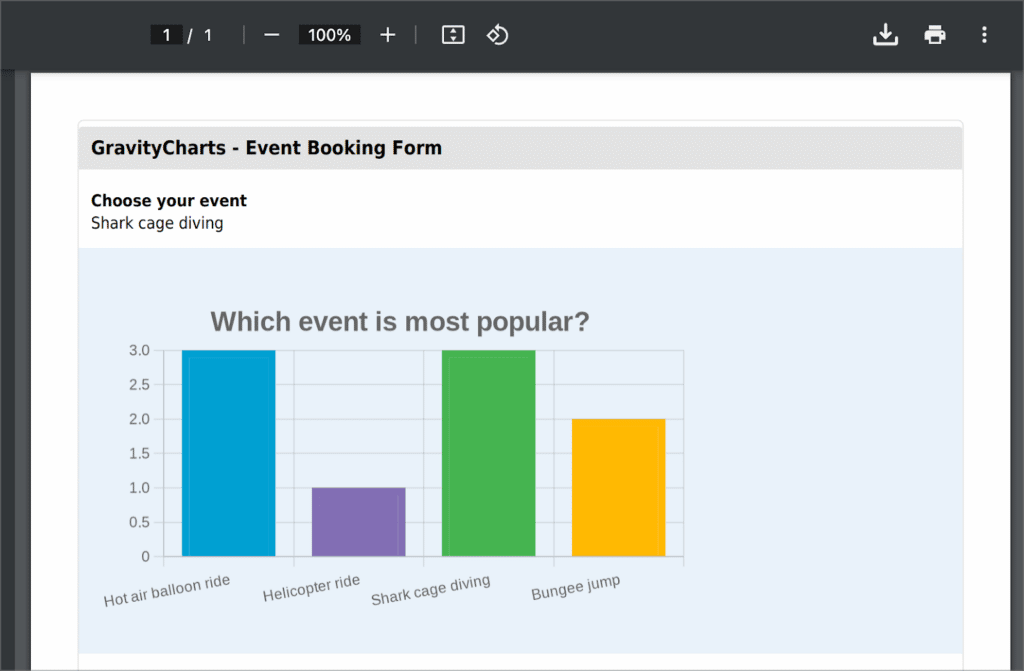
When you’re done, save your form. When you open your PDF report, you’ll see your chart embedded inside.
That’s it!
Get started with image charts today!
In this edition of Feature Highlights, we took an in-depth look at the Image Charts feature for the GravityCharts add-on. This feature allows you to save your charts as images for embedding into notification emails or PDF reports.
If you’re new to GravityCharts and you want to learn more about displaying your Gravity Forms data on a chart, read How to Display Your Gravity Forms Data Using Charts.

Helpful tips right in your inbox.
Subscribe to get the latest articles, information on releases and helpful Gravity Forms tips!
More articles

How to build a WordPress CRM without code (a contact database you own)
Build a simple WordPress CRM with GravityView. Turn the Gravity Forms entries you already collect into a no-code contact database you own, with no monthly fees.

Launch Log: Distance sorting for radius searches, DataTables search improvements, and import reliability fixes
The latest GravityKit releases add distance sorting to map searches, bring built-in search to DataTables, and fix GravityCharts and GravityImport edge cases.
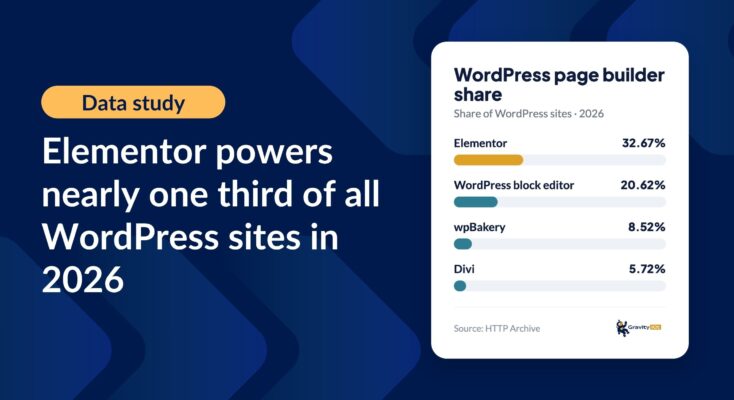
WordPress page builder market share 2026: Elementor leads at 32.67%
Elementor reaches 32.7% of WordPress sites. WordPress Block Editor 20.6%, wpBakery 8.5%, Divi 5.7%. Latest HTTP Archive crawl, share-of-WordPress basis throughout.