
GravityCharts
Turn Gravity Forms entries into interactive charts and graphs to build dashboards, reports, and derive data-driven insights.


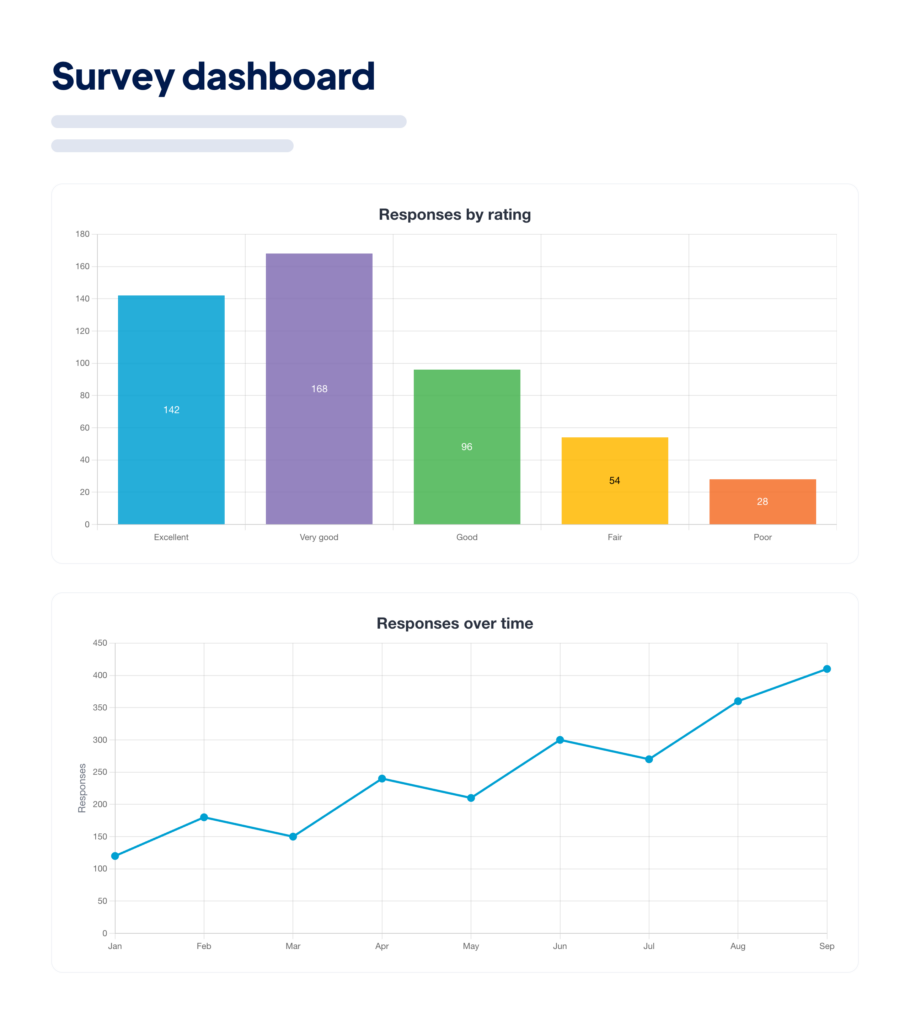
Unlock insights from your Gravity Forms data
Convert raw entries into clear, real-time visualizations. Spot trends, compare segments, and share insights without exporting to spreadsheets.
- Bring surveys, polls, and user dashboards to life with interactive charts.
- Leverage modern, responsive designs with accessible color palettes.
- Support for time-based plotting.
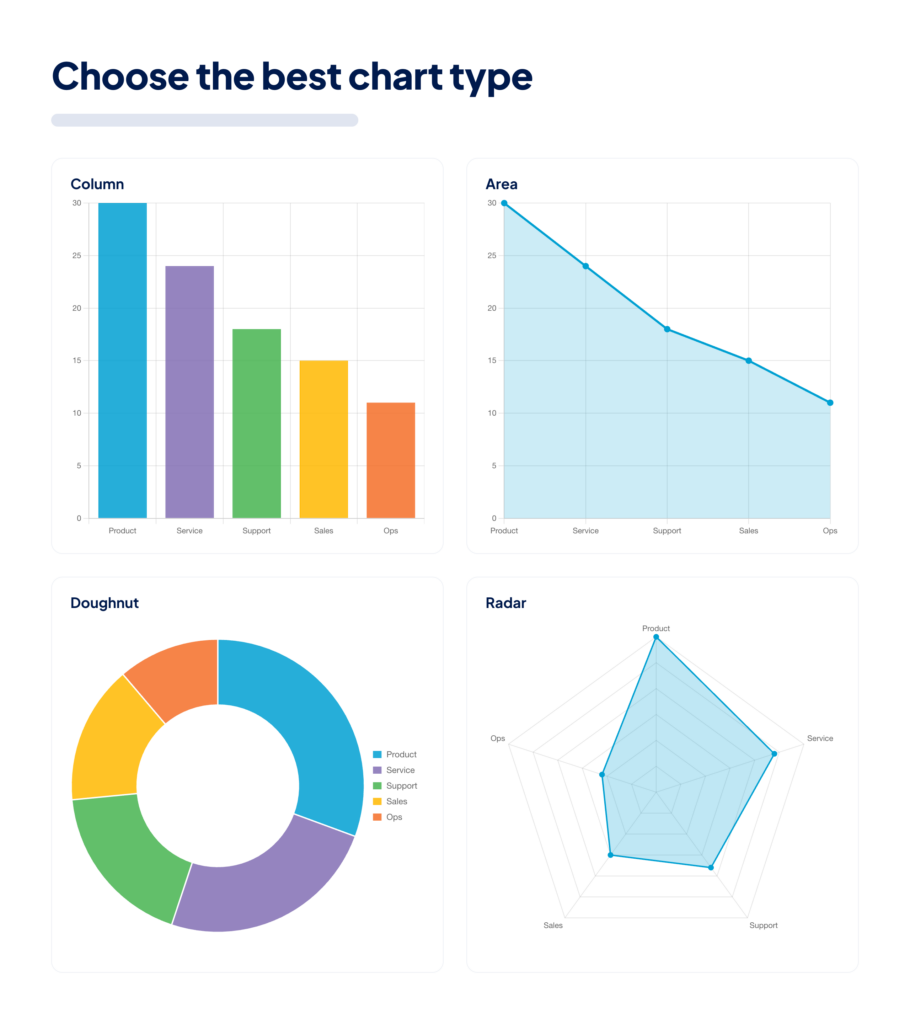
Deliver custom solutions that wow clients
Choose the best chart type for the job: line, area, bar, column, radar, pie, and more—so each insight is easy to grasp at a glance.
- Plot entries over time and apply advanced filters and conditional logic to highlight what matters.
- Add visuals via the WordPress block editor or save as PNGs for confirmations, email notifications, and PDFs.
- Create data dashboards and reports.
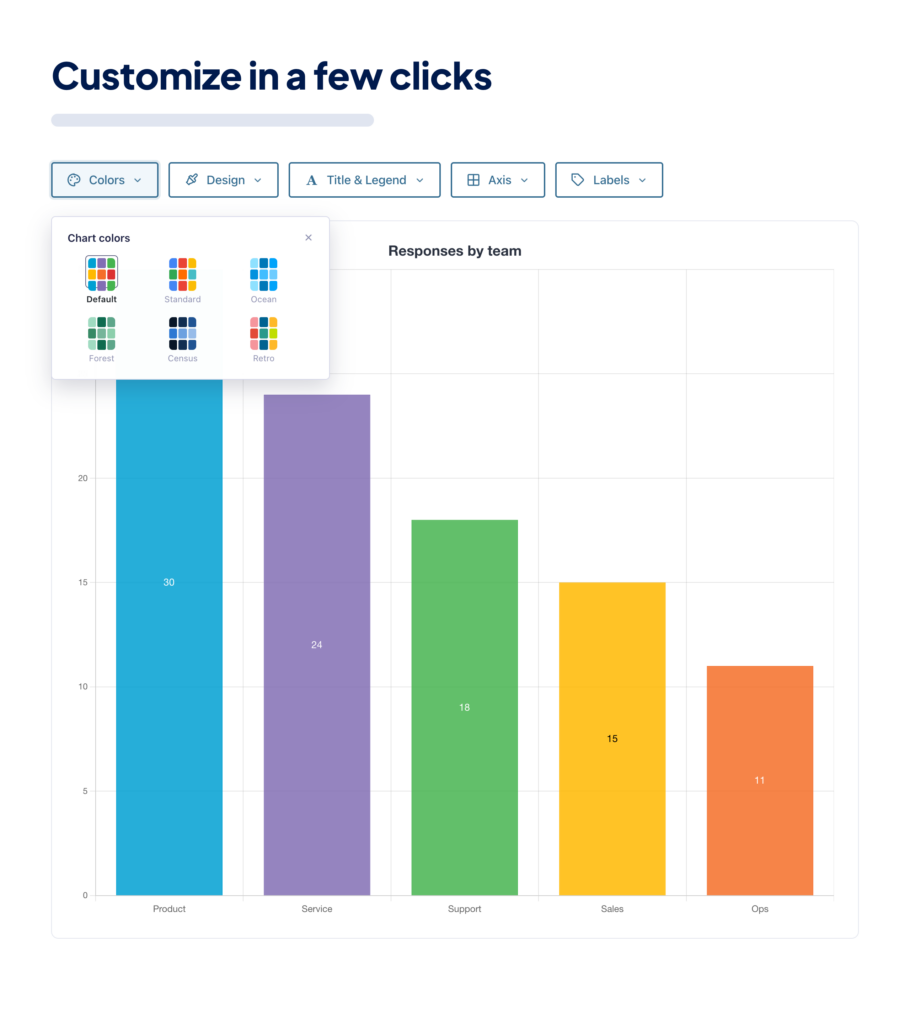
Customize with user-friendly tools
Create beautiful charts in a few clicks—an intuitive UI with live previews, predefined color palettes, and responsive defaults helps you go from idea to insight quickly.
- Deep integration with GravityView making it easy to create dynamic data dashboards.
- Built on Chart.js with hooks and filters for granular control.
- Flexible for no-code users; extensible for custom workflows.
Trusted by thousands of businesses and developers

Not only does GravityKit have excellent support with fast response times, they continually add a lot of new features to their products.
Simple pricing.
Infinite possibilities.
GravityCharts is trusted by agencies, nonprofits, developers, and WordPress users all over the world.
Our complete Kit of essential tools for extending and enhancing Gravity Forms—everything you need to build powerful web apps and workflows.
- All GravityKit Add-Ons
- All GravityView Layouts & Extensions
- Perfect for heavy Gravity Forms users
- Priority support via email
- Save $713 (65%) vs. buying separately
Turn Gravity Forms entries into interactive charts and graphs to build dashboards, reports, and derive data-driven insights.
- Create line, bar, pie, radar, and area charts
- Live-updating chart preview
- Advanced conditional logic
- Charts update dynamically
- Highly customizable with modern styles

We proudly offer a 30-day money-back guarantee
We want you to be 100% happy with your purchase, or we’ll make it right.
Got questions? Ask away!
Got a question about GravityCharts or any other GravityKit plugin? Our AI assistant can help you find answers instantly.
Ready to get started?
Visualize Gravity Forms data with customizable charts.
You will love our other Gravity Forms add-ons, too.
All Access Pass
Our complete Kit of essential tools for extending and enhancing Gravity Forms—everything you need to build powerful web apps and workflows.

GravityView Pro
Take GravityView to the next level with all premium layouts, extensions, and advanced functionality in one package.
GravityView
Display Gravity Forms entries on the front-end of your site and build powerful web applications.

GravityImport
Import entries from CSV files into Gravity Forms to transfer data, create new forms, or update existing entries.

GravityEdit
Quickly edit Gravity Forms entries inline to save time, reduce clicks, and streamline your workflow.

GravityActions
Update multiple Gravity Forms entries at once, send bulk emails, and streamline your workflow.

GravityCalendar
Turn Gravity Forms entries into dynamic calendars to showcase events, schedules, appointments, and more.

GravityExport
Export Gravity Forms entries to Excel, CSV, or PDF and share them instantly with secure download links.

GravityMath
Perform advanced calculations on Gravity Forms entries to display totals, averages, or build custom calculators.

GravityRevisions
Track, compare, and restore changes made to Gravity Forms forms and entries with a full version history.

GravityMigrate
The ultimate, all-in-one solution for migrating Gravity Forms data, including forms, entries, settings, Views, feeds, file uploads, workflows, and more.

GravityBoard
Display Gravity Forms entries on collaborative kanban boards: manage projects, coordinate with your team, and streamline your workflows.
GravitySearch
Search Gravity Forms entries across every form from one screen, with advanced filters, instant previews, and bulk actions.
Have more questions?
Here are a few common questions that help explain what is possible with the power of GravityKit.
You must log in to submit a review.