
Published
•
Updated
How to build an internal admin dashboard on WordPress without code
Build an internal WordPress admin dashboard with GravityView Dashboard Views. Embed forms data, charts, and KPIs inside wp-admin with role-based access.

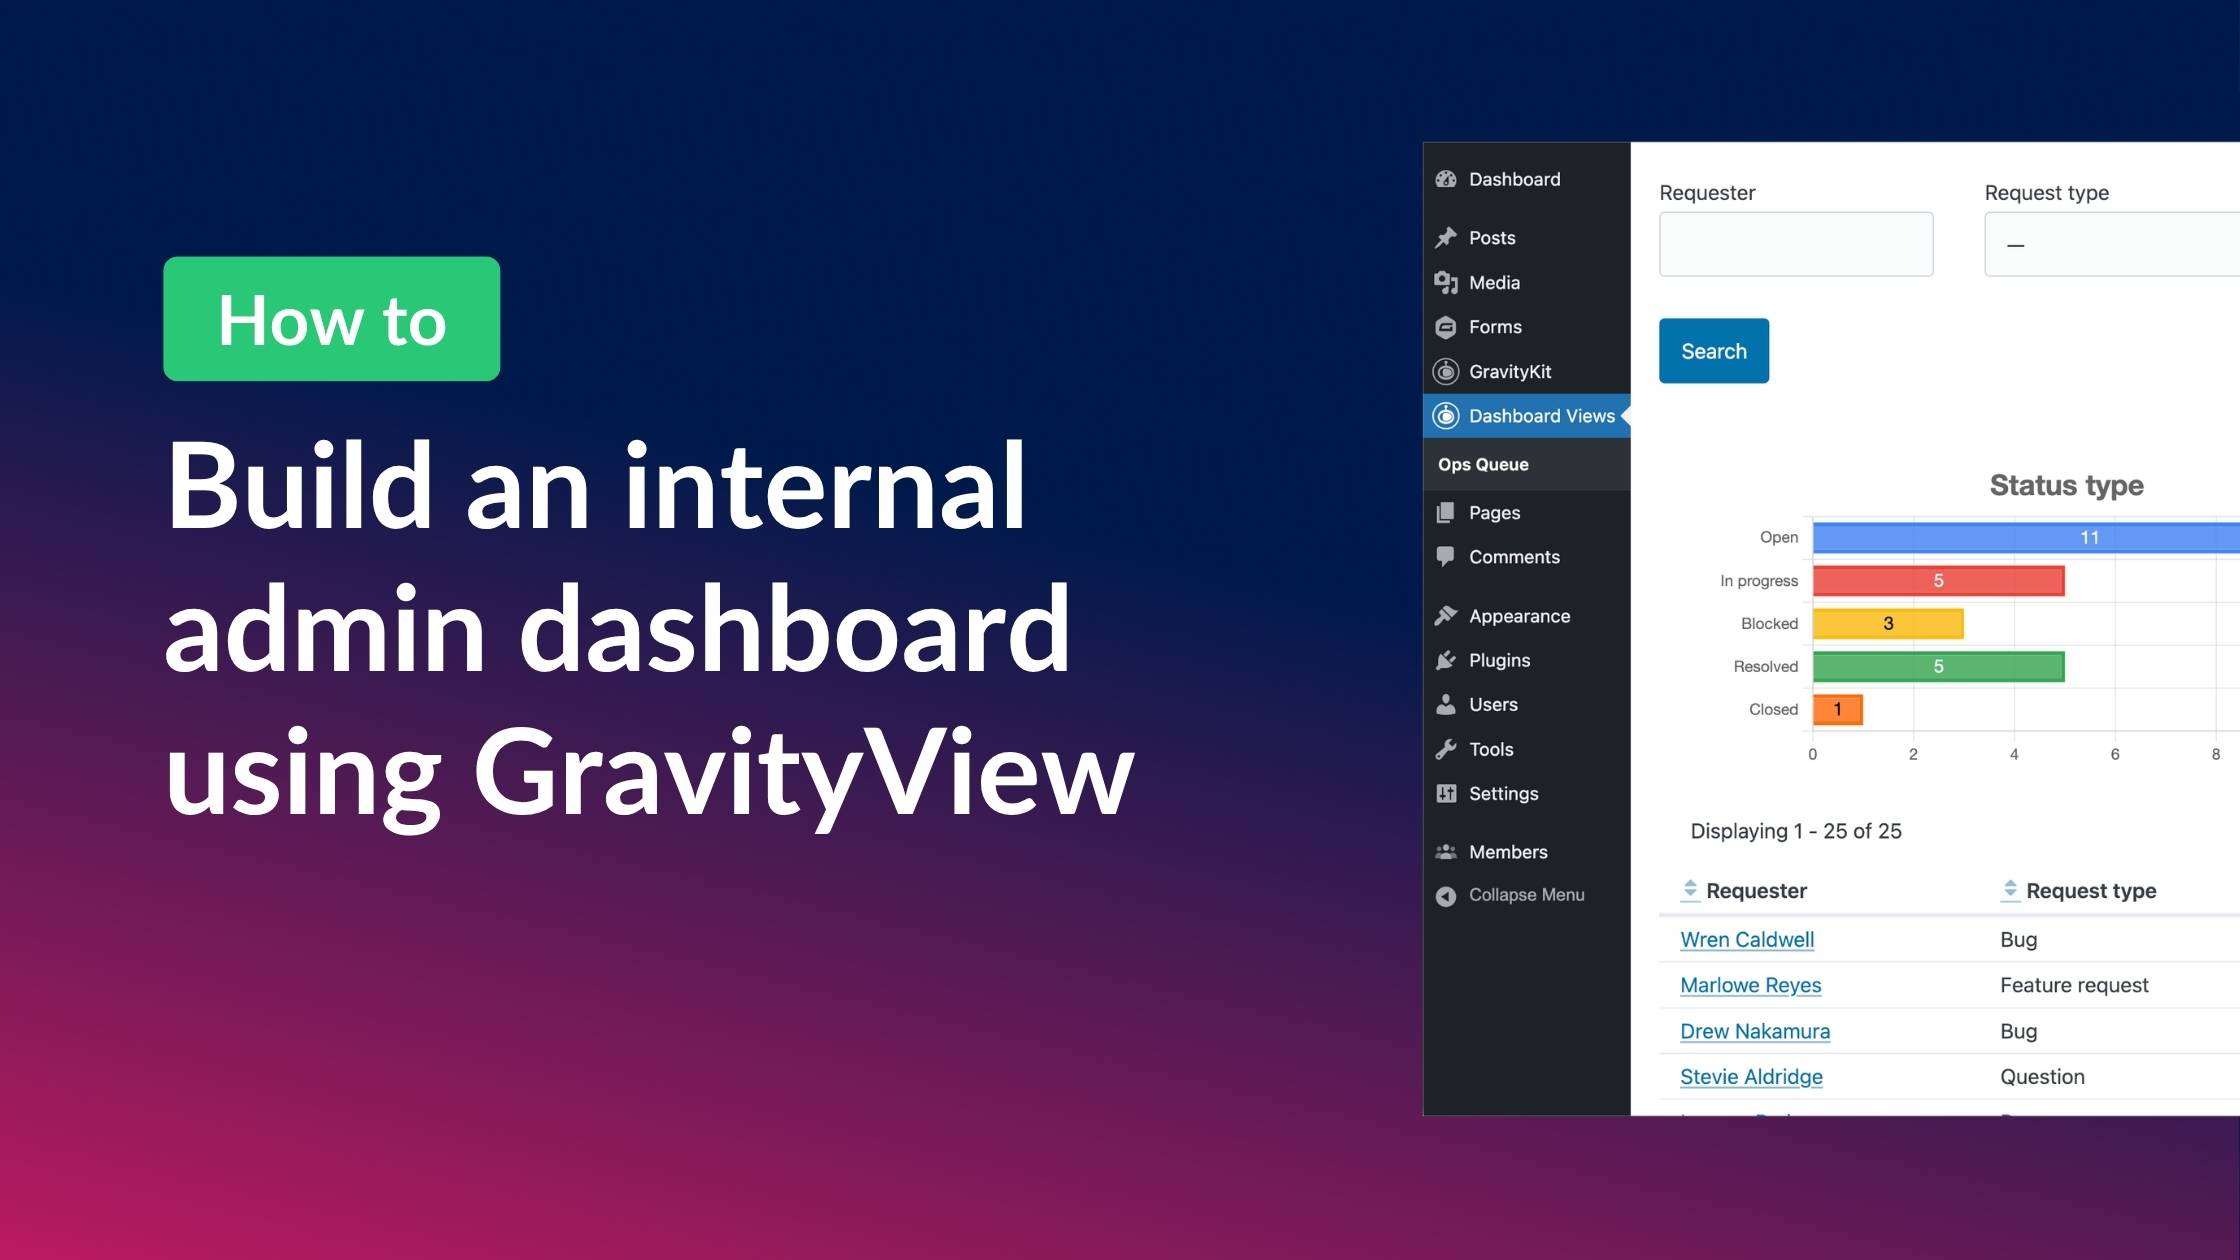
Most of our tutorials assume you’re building something for the public side of your site. But what if you want the opposite? A WordPress custom admin dashboard for your internal team, gated by login, with no public URL to leak.
In this tutorial I’ll show you how to build exactly that, using GravityView Dashboard Views. We’ll create an “Ops queue” inside /wp-admin/ where a small team can triage internal requests: a sortable table of all open items, KPI charts at the top, and an optional kanban view for visual-thinkers. Everything stays inside the WordPress admin, behind login, with role-based access.
This is meant for site builders, agencies, and ops leads who want a lightweight internal tool on WordPress without standing up a separate BI platform. If you’re looking for a public-facing reporting page instead, our WordPress business intelligence guide is the better starting point. This one is for logged-in staff working inside the admin.
Let’s dive in!
What you’ll need
- Gravity Forms (Pro or Elite) – for the “Internal request” form that captures requests.
- GravityView Pro – for rendering form data as a sortable, searchable table.
- Dashboard Views Extension – for embedding Views inside wp-admin with role gating and an internal-only toggle.
- GravityCharts – for the status and request-type breakdown charts at the top of the dashboard.
- Optional: GravityBoard – for a kanban view of the same data, grouped by status.
If you grab All Access, every GravityKit add-on above is bundled into one flat license, which works out cheaper than two of the optionals individually.
Sneak peek
Two views drive the whole thing, both living inside the WordPress admin behind login.
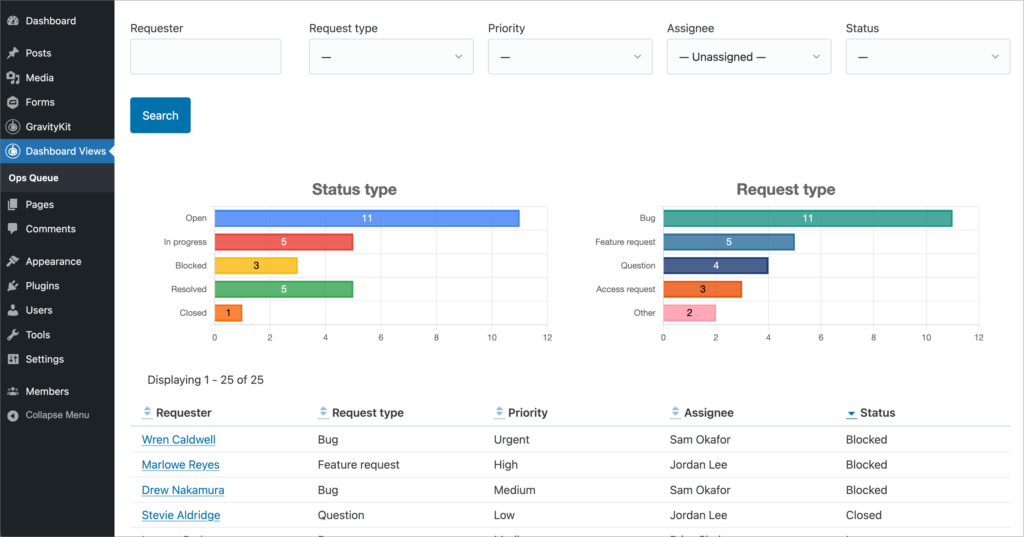
The dashboard view is the default. Charts at the top show request volume by status and type at a glance, and a sortable, searchable table below lists every request with assignee, priority, and status. Click any row to drill into the full request details or update its status.
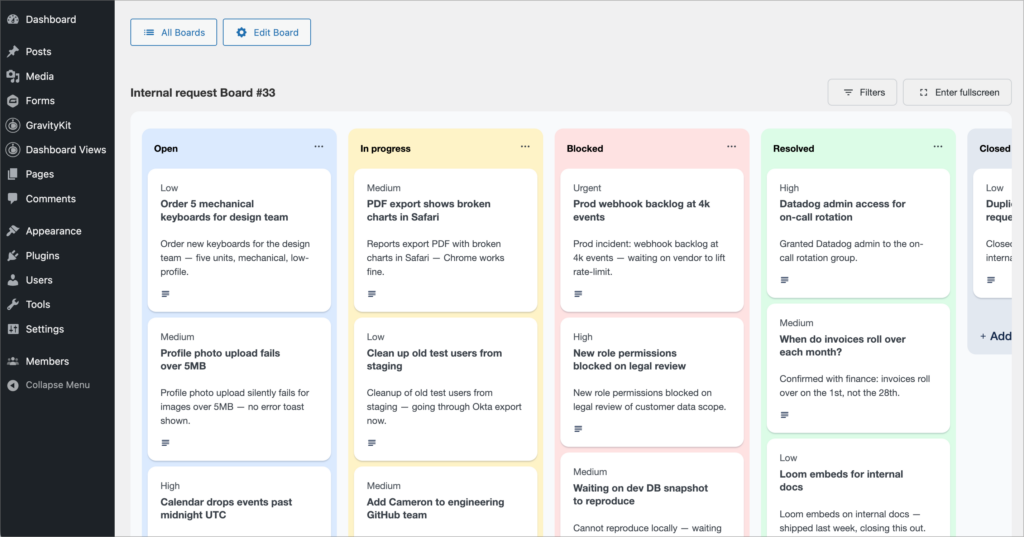
The kanban view is the alternative for teams that prefer to see in-progress work visually. Each lane is a status (Open, In progress, Blocked, Resolved, Closed) with cards you can drag between lanes to update the entry in place.
Wanna try it?
Spin up a demo
See what you can build with GravityView — explore the live demo.
Why internal versus front-end matters
Admin-only dashboards remove the public URL surface entirely. There’s no guessable slug, no scraping risk. Login is enforced by WordPress core, so you don’t need a separate auth plugin or a membership wall. Role gating is native: you decide which admin roles see the menu item.
The trade-off is that everyone who needs access has to have a WordPress user account. For an internal team, that’s a feature rather than a limitation.
What Dashboard Views actually does
The GravityView Dashboard Views Extension adds a top-level “Dashboard Views” admin menu and lets you assign any GravityView View to either an admin menu page or a dashboard widget on the WordPress home screen. It provides an internal-only toggle that removes the front-end URL for the View entirely, so a stray link can’t expose it. All standard GravityView capabilities (search, sort, filter, single entry, edit entry) carry over inside the admin.
Planning the dashboard
For this tutorial we’ll use an ops or support team scenario with three things on the dashboard: a queue of open requests, KPI charts at the top, and an optional kanban board.
The data shape is one Gravity Form (the “Internal request” form), one GravityView View (the table of requests), two charts (status counts and request type counts), and one optional GravityBoard for kanban. Access is gated to logged-in users by default, with an optional custom “Ops team” role for non-admin staff.
Step 1: Build the form that feeds the dashboard
Start in Gravity Forms. Create a new form called “Internal request” with these fields:
- Requester (Name, required)
- Request type (Select: Bug, Feature request, Question, Access request, Other)
- Priority (Radio: Low, Medium, High, Urgent)
- Assignee (Text or Select, with your team members as choices)
- Status (Select: Open, In progress, Blocked, Resolved, Closed)
- Notes (Paragraph, this is the issue description)
- Created date (Date, optional, the entry’s
date_createdworks too)
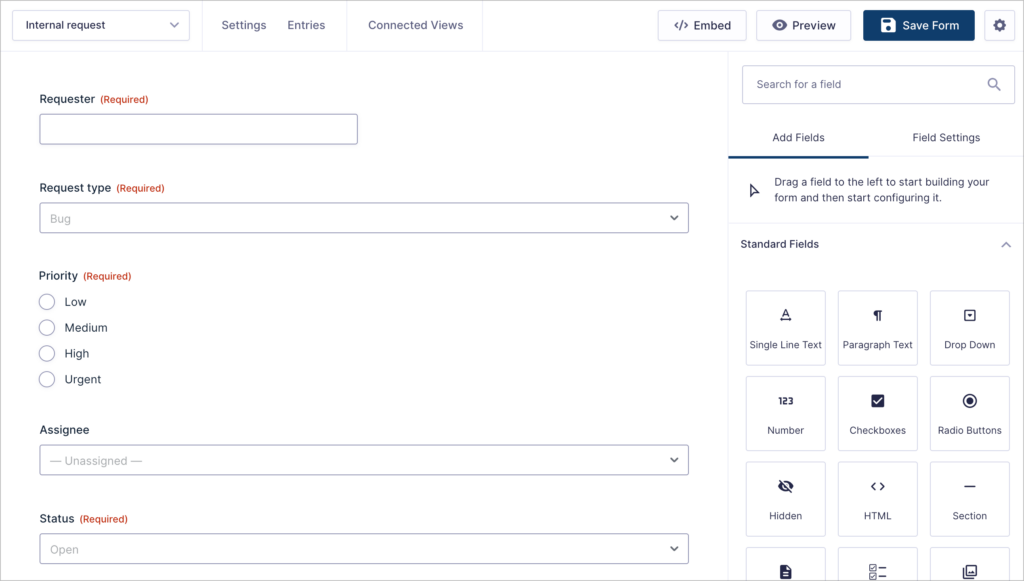
If your team submits requests internally too, you can lock the form behind login or surface it on a private intake page. Either way, this form is the single source of truth for the dashboard.
Step 2: Build the View
Hover over GravityKit in your admin sidebar, click New View, name it “Ops queue,” pick the “Internal request” form as the data source, and choose the Table layout. The Table layout works well here because it’s dense, scannable, and matches the native WP list-table aesthetic.
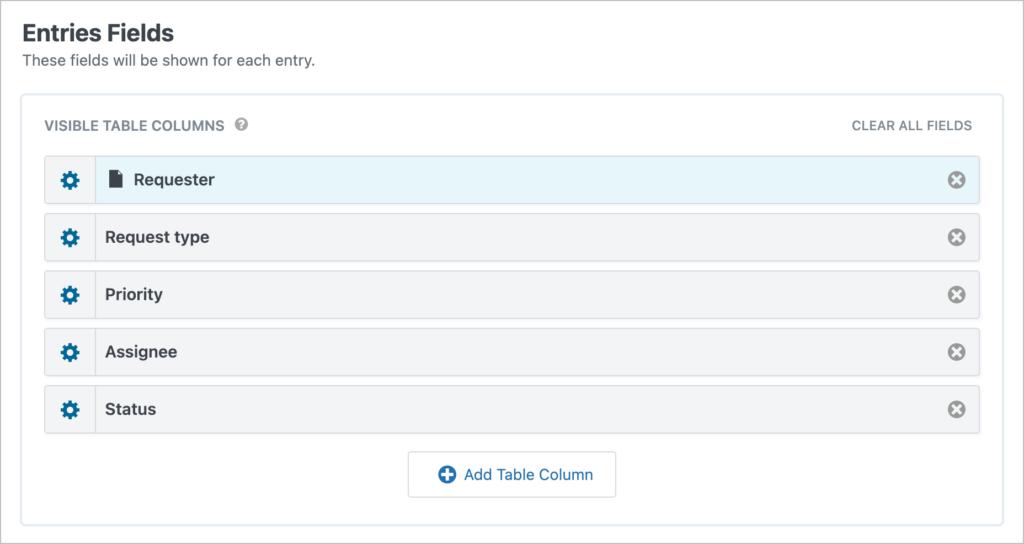
In the Multiple Entries Layout tab, drag in the fields you want as columns: Status, Requester, Request type, Priority, Assignee, Date. Make the Requester field a link to Single Entry so team members and click to view the full request.
Click on the Single Entry Layout tab and add all the entry fields here.
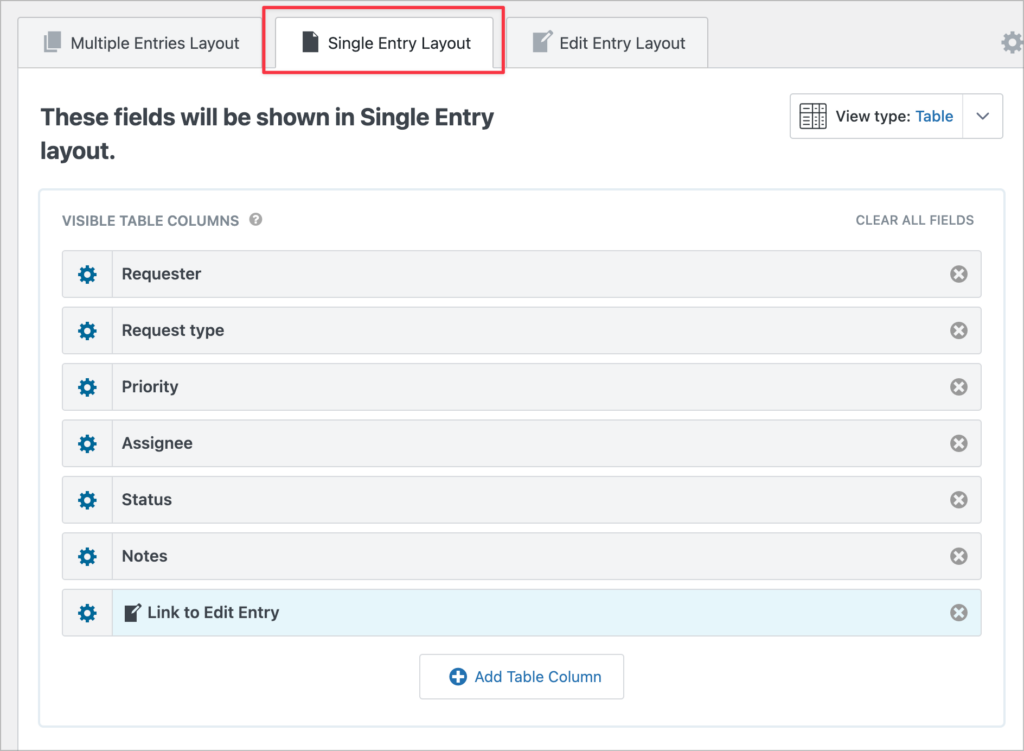
Optional: Add a “Link to Edit Entry” field so the team can click into a row to update status in place.
Now scroll down to the View Settings panel and set the default sort to Status ascending, then Date descending. That floats Open items to the top of the queue.
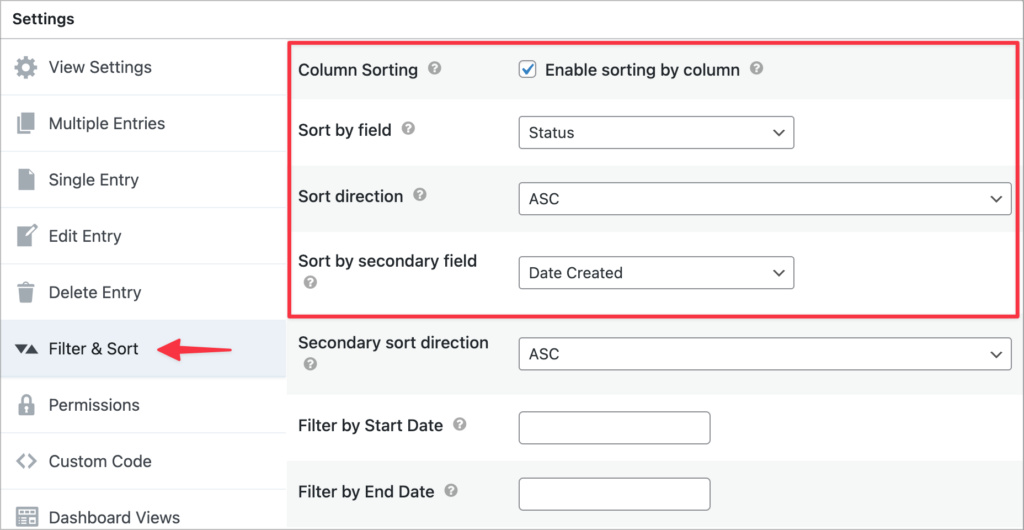
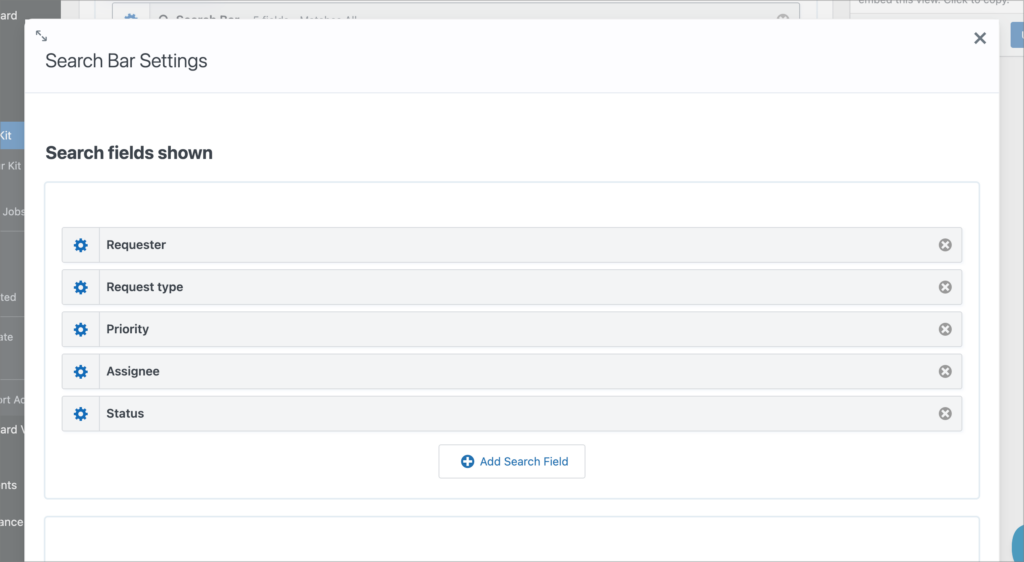
Lastly, add the Search Bar widget so the team can filter to “my items,” “by priority,” or “open this week.”
Step 3: Embed the View in wp-admin with Dashboard Views
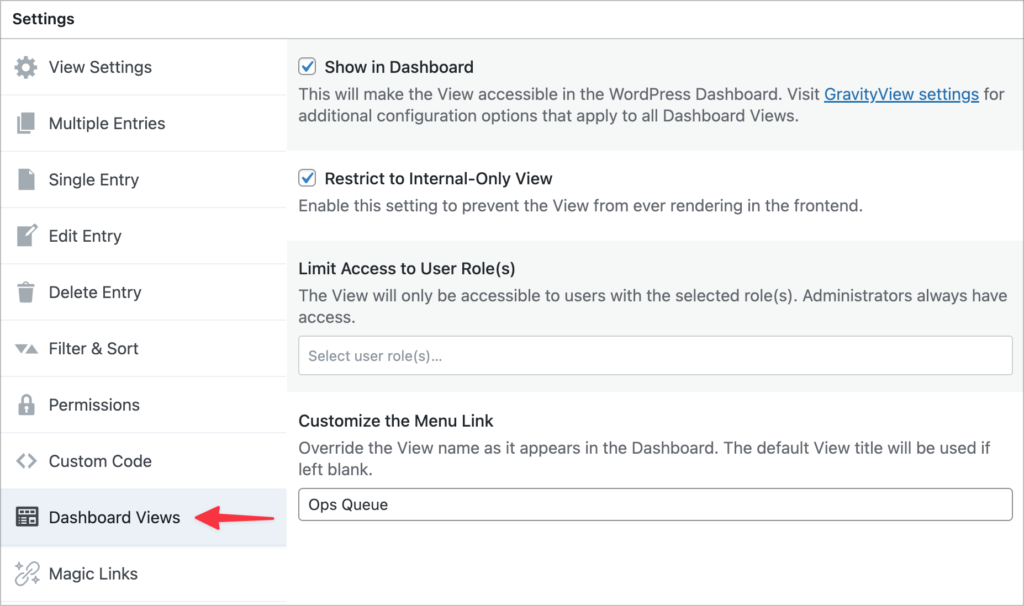
With the View built, install and activate the Dashboard Views extension. Back in the View editor, you’ll see a new Dashboard Views settings panel.
Set the menu placement to a top-level admin menu item with a custom label (“Ops queue”). Next, toggle on Internal-only so the View no longer renders on the front-end. In the same panel, limit access to user role (or leave blank to make accessible to all logged-in users).

Pro Tip
If you need a custom role for non-admin staff, the free Members plugin is the standard tool. It’s not the focus of this tutorial, but worth knowing about.
Save the View and refresh wp-admin. You should see your new menu item in the sidebar.
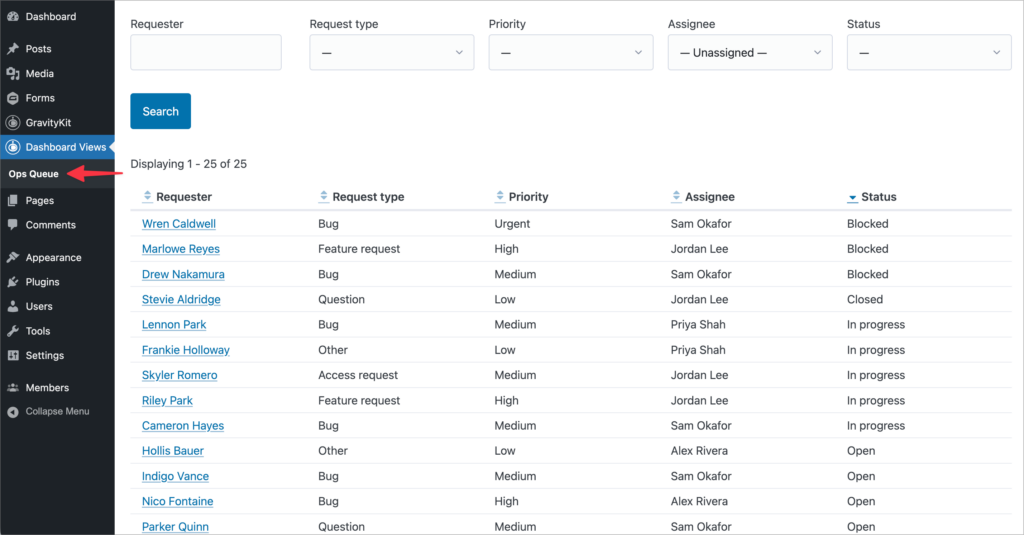
Click it to open the dashboard. Then log in as each role to confirm visibility works the way you want.
Step 4: Add charts with GravityCharts
To put KPI charts at the top of the dashboard, create two new GravityCharts feeds that show aggregate metrics from your ops requests.
Next, open the View editor again and add two GravityCharts widgets into the top widget zone above the entries table. Place one in the left column and one in the right so they sit side-by-side. In our example:
- Chart 1: a bar chart grouped by Status (Open, In progress, Blocked, Resolved, Closed).
- Chart 2: a bar chart grouped by Request type (Bug, Feature request, Question, Access request, Other).
When you save and reload the dashboard, the charts render at the top with the table below! The charts will also update dynamically when you perform searches.
Step 5 (optional): Add a kanban view with GravityBoard
If your team prefers to see in-progress work visually, GravityBoard renders the same entries as a kanban grouped by Status. Set the lane field to Status and the lanes auto-populate from your Status field choices. Configure card fields: title from the request, description from Notes, label from Priority, lane from Status. Style the lanes with subtle colors per status so the board reads at a glance.
All GravityBoards can be viewed inside wp-admin by default. The trade-off is that kanban is great for in-progress work but worse than a table when you have hundreds of entries to scan.
Step 6 (optional): Inline edit and export from inside the admin
Two more add-ons round out the dashboard:
- GravityEdit lets the team update Status, Assignee, or Priority directly from the table, with no row-open required. It’s the difference between a one-click status change and a three-click status change.
- GravityExport adds a CSV, Excel, or PDF export capabilities to the admin View. Useful for periodic reporting or handoffs to external stakeholders.
Wrapping up
That’s a complete internal admin dashboard built on Gravity Forms and GravityView. The recipe: one Gravity Form for the data, a GravityView Table View for the queue, Dashboard Views to embed it inside wp-admin with internal-only and role gating, and GravityCharts for the visuals. Add GravityBoard for kanban, GravityEdit for inline updates, and GravityExport for reporting if you want richer workflows.
Ready to give your team a workspace that lives inside WordPress? Get GravityView Pro and you can have this built before lunch!
Get better at Gravity Forms, one email a week
New GravityKit releases, practical Gravity Forms tutorials, and subscriber-only discounts. One short email every week, unsubscribe anytime.
More articles
How to migrate from WPForms to Gravity Forms without rebuilding your forms
Move your WPForms forms into Gravity Forms with GravityMigrate, keeping their fields, conditional logic, confirmations, and notifications. Then bring your entries across with GravityImport.

Launch Log: Search Everything matches what fields show, steadier map searches, and security updates
GravityView’s Search Everything now matches the names fields display, and GravityView, Maps, GravityCalendar, and Dynamic Lookup get important security fixes.
How to build a WordPress client portal with Gravity Forms
Build a client portal on WordPress where each client logs in to see their profile, their requests, and the documents they’ve shared, using Gravity Forms and GravityView.