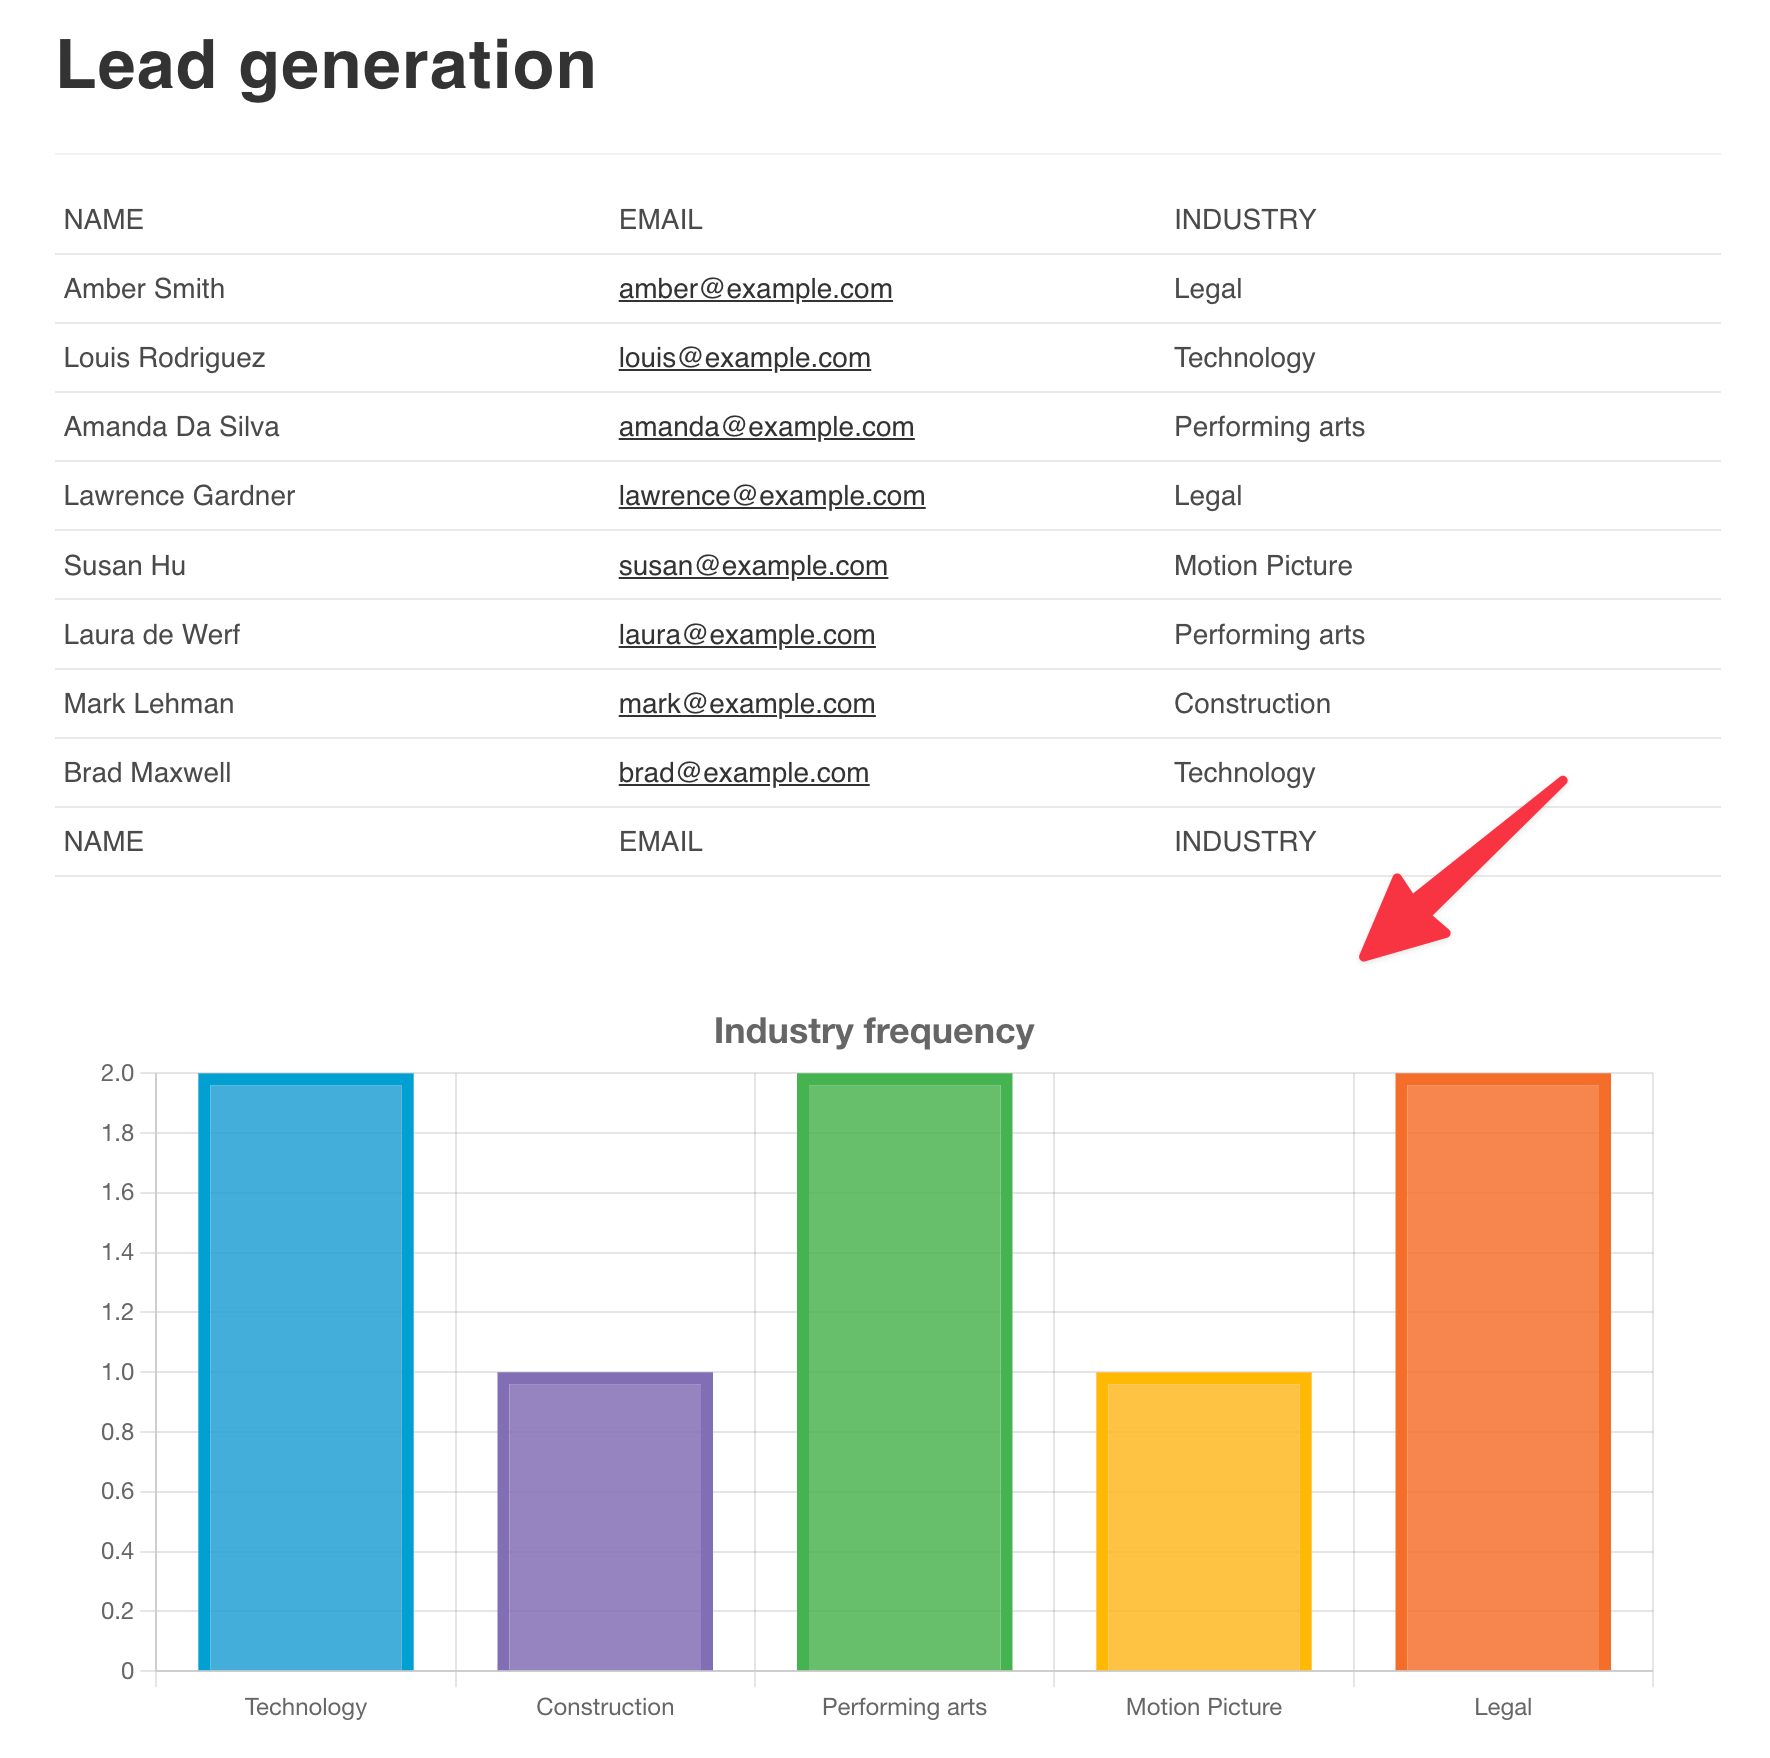
Adding a GravityCharts Widget to GravityView
GravityCharts integrates with GravityView, allowing you to add charts to your front-end applications.
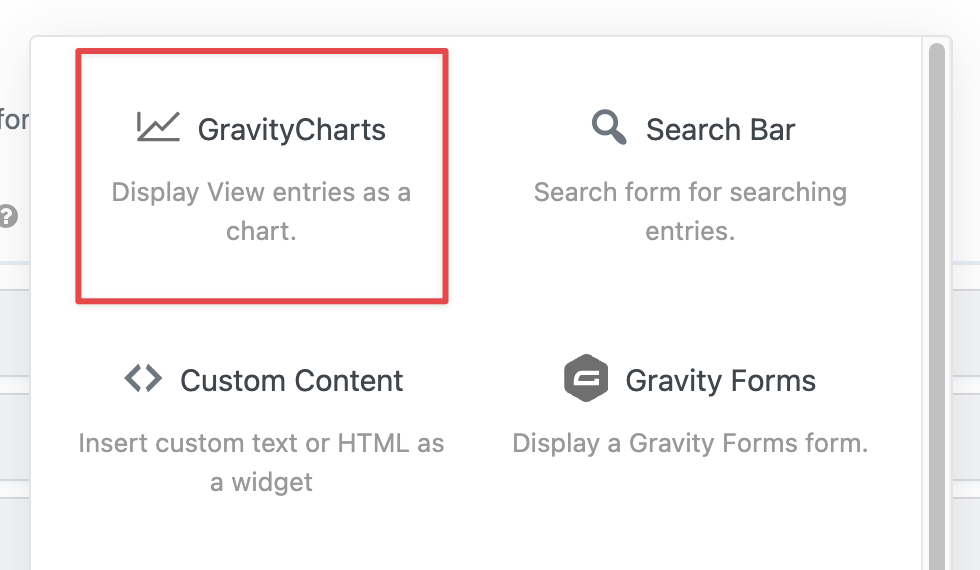
First, ensure that you have created at least one chart for the form attached to your View. Next, edit your View, click the ‘Add Widget’ button and select the GravityCharts widget.
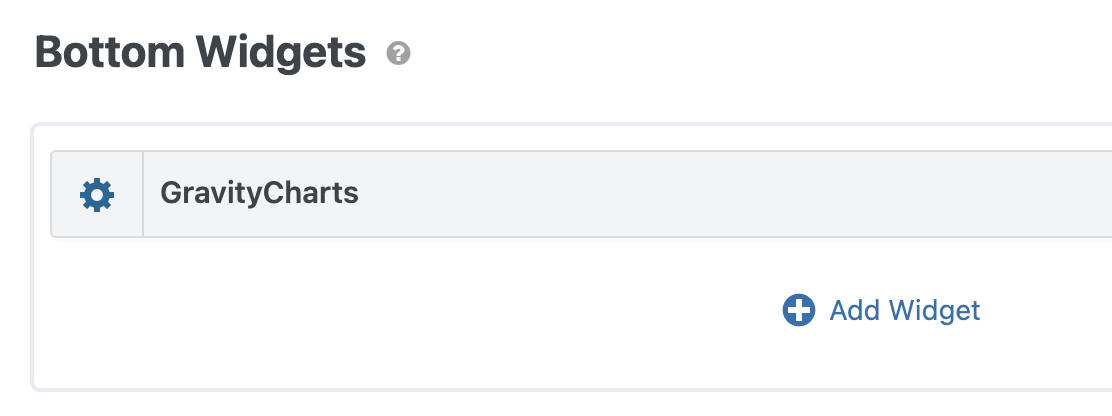
Add the widget to the Top Widgets area to show the chart above the entries, or to Bottom Widgets to show it below them.
Now click on the gear icon to configure the widget settings.
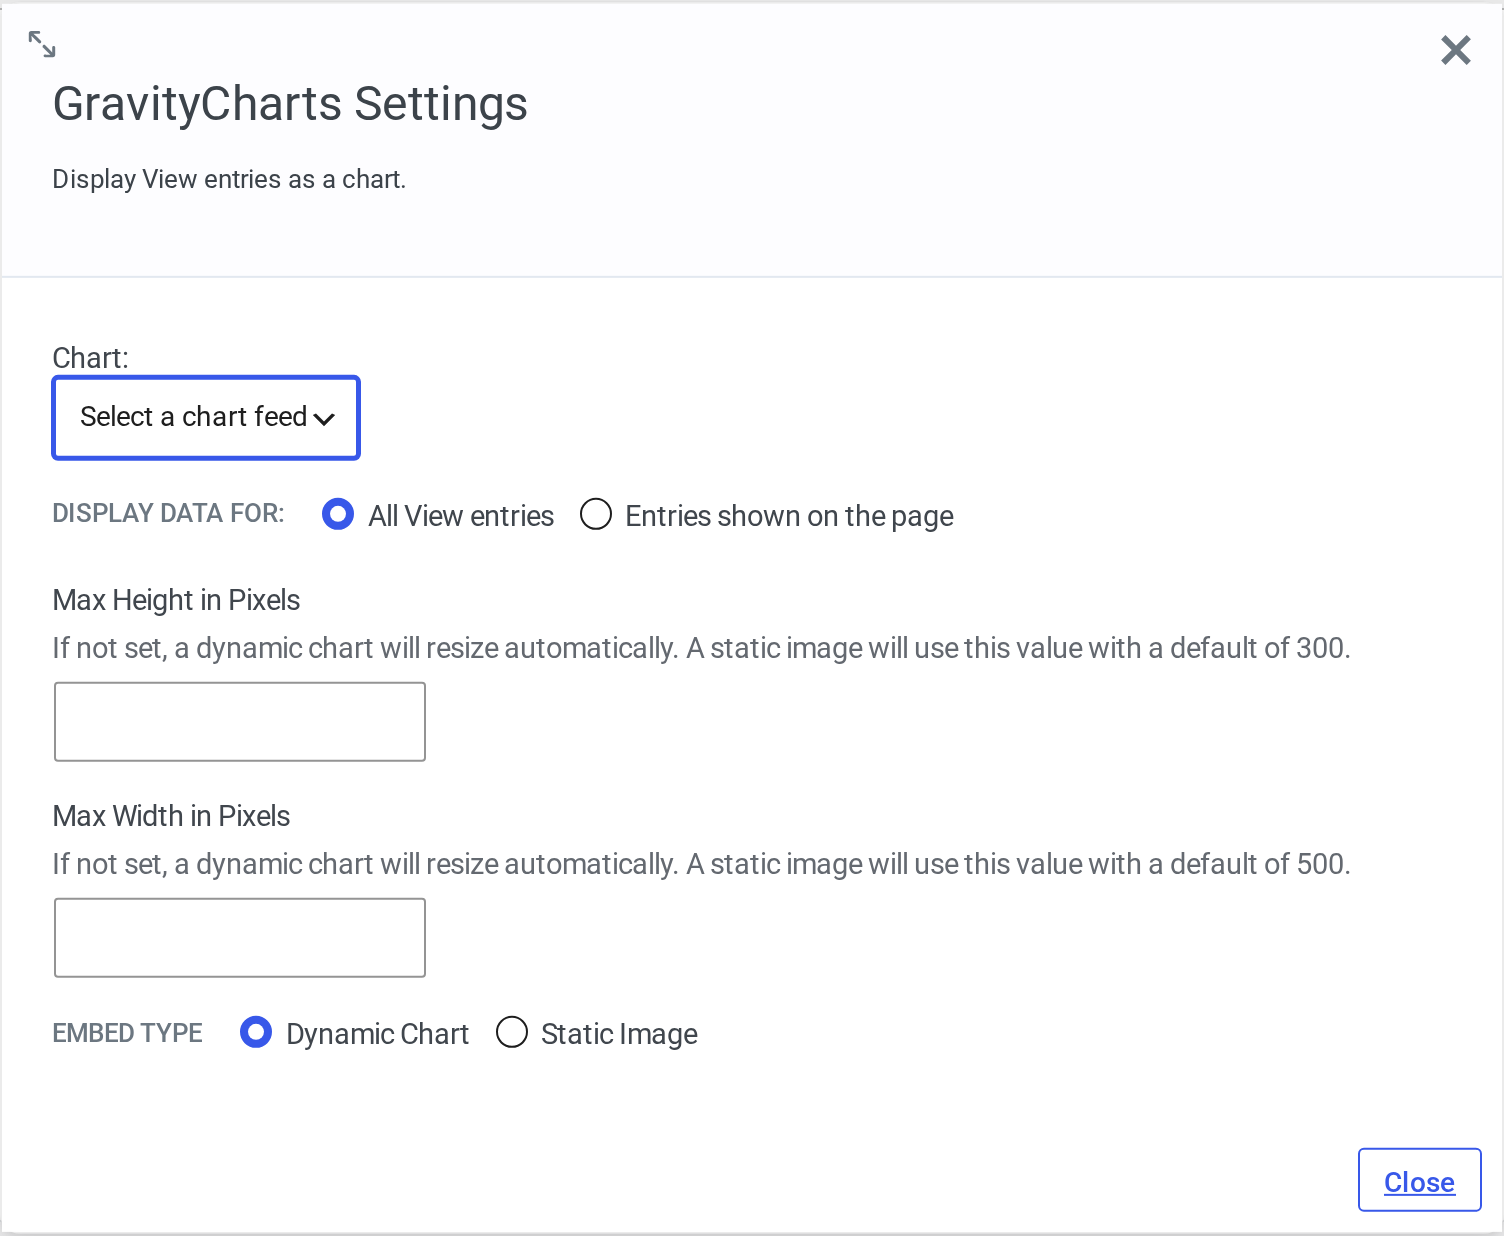
Here you can select the chart you want to embed and choose whether to display data from all View entries or only those shown on the current page, so a visitor’s search or pagination narrows the chart with it. You can also set a max height and width: leave them empty and a dynamic chart resizes itself, while a static image falls back to 300 and 500 pixels. The Embed Type setting switches between an interactive Dynamic Chart and a generated Static Image, which is useful where scripts cannot run.
When you’re done, update your View and check it on the front end.