
Modifying Chart.js settings with filters
GravityCharts draws its charts with Chart.js 4. These filters change the Chart.js settings and data behind your charts, beyond what a chart’s own settings offer. The Chart.js documentation lists every option they accept.
Note: The PHP examples on this page go in your site’s code. See Where to put code samples.
gk/gravitycharts/chart-library-options #
This filter changes the default Chart.js options for every chart on the site.
A chart’s own settings are applied after these defaults, so an option the chart sets itself, such as Border Width or Legend Position, keeps the chart’s value. Use this filter for options the chart settings don’t cover. Animations, for example, are off by default.
$fields(array): The default Chart.js options.$library(string): The chart library,chart.js.
Example: turn on animations
/**
 * Turns on animations for every chart on the site.
 *
 * @param array  $fields  The default Chart.js options.
 * @param string $library The chart library, "chart.js".
 *
 * @return array The default Chart.js options.
 */
add_filter( 'gk/gravitycharts/chart-library-options', function ( $fields, $library ) {
    $fields['animation'] = [
        'duration' => 1000,
        'easing'   => 'easeInOutQuart',
    ];

    return $fields;
}, 10, 2 );gk/gravitycharts/api/chart/options #
This filter changes the Chart.js options of one chart, after its own settings are applied. Check the chart ID so the change reaches only that chart. The ID is in the ID column on the All Charts screen (GravityKit, then All Charts).
$response(array): The chart’s Chart.js options.$feed_id(int): The chart ID.
Example: add a title and move the legend
/**
 * Adds a title to chart 5 and moves its legend below the chart.
 *
 * @param array $response The chart's Chart.js options.
 * @param int   $feed_id  The chart ID.
 *
 * @return array The chart's Chart.js options.
 */
add_filter( 'gk/gravitycharts/api/chart/options', function ( $response, $feed_id ) {
    if ( 5 !== $feed_id ) {
        return $response;
    }

    $response['plugins']['title']['display'] = true;
    $response['plugins']['title']['text']    = 'Lessons by instrument';

    $response['plugins']['legend']['position'] = 'bottom';

    return $response;
}, 10, 2 );Set single keys, as this example does, so the rest of the chart’s title and legend settings stay as they are.
Example: whole numbers and light axes for a dark background
A chart that counts entries steps its value axis by halves when the counts are small. Setting the precision to 0 keeps the steps whole. The colors set the axis text, the grid lines, and the axis lines.
/**
 * Shows whole numbers on chart 5's value axis and lightens its axes for a dark background.
 *
 * @param array $response The chart's Chart.js options.
 * @param int   $feed_id  The chart ID.
 *
 * @return array The chart's Chart.js options.
 */
add_filter( 'gk/gravitycharts/api/chart/options', function ( $response, $feed_id ) {
    if ( 5 !== $feed_id ) {
        return $response;
    }

    // Count every step as a whole number: 0, 1, 2, 3 instead of 0, 0.5, 1, 1.5.
    $response['scales']['y']['ticks']['precision'] = 0;

    // Light axis text, grid lines, and axis lines.
    foreach ( [ 'x', 'y' ] as $axis ) {
        $response['scales'][ $axis ]['ticks']['color']  = '#e2e8f0';
        $response['scales'][ $axis ]['grid']['color']   = 'rgba(226, 232, 240, 0.25)';
        $response['scales'][ $axis ]['border']['color'] = '#e2e8f0';
    }

    return $response;
}, 10, 2 );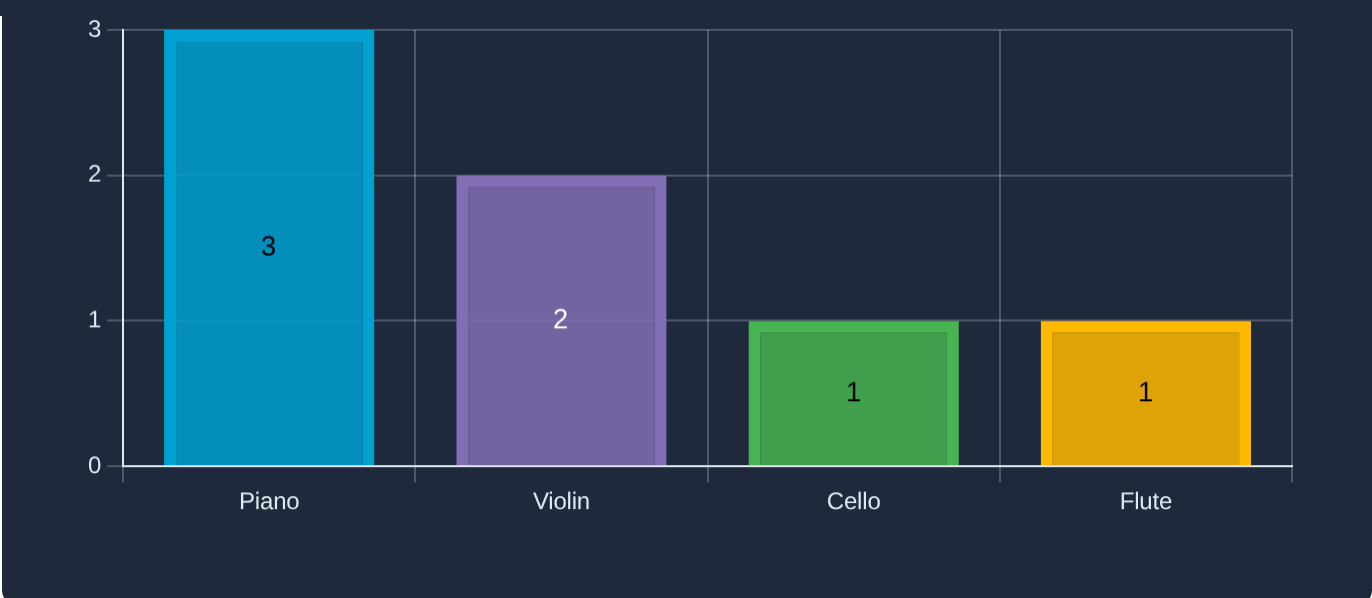
Bar and line charts have an x and a y axis, and on a horizontal bar chart the values are on the x axis. Radar and polar area charts have a single r scale, and pie charts have none.
Example: hide the value axis and the grid on a bar chart
These lines hide a bar chart’s value axis and the grid lines between its bars. With Enable Labels on, the values still show on the bars.
/**
 * Hides chart 5's value axis and the grid lines between its bars.
 *
 * @param array $response The chart's Chart.js options.
 * @param int   $feed_id  The chart ID.
 *
 * @return array The chart's Chart.js options.
 */
add_filter( 'gk/gravitycharts/api/chart/options', function ( $response, $feed_id ) {
    if ( 5 !== $feed_id ) {
        return $response;
    }

    // Hide the value axis.
    $response['scales']['y']['display'] = false;

    // Hide the grid lines between the bars.
    $response['scales']['x']['grid']['display'] = false;

    return $response;
}, 10, 2 );On a horizontal bar chart, the values run along x, so swap x and y in both lines.
Example: style the tooltip
/**
 * Styles the tooltip of every chart.
 *
 * @param array $response The chart's Chart.js options.
 * @param int   $feed_id  The chart ID.
 *
 * @return array The chart's Chart.js options.
 */
add_filter( 'gk/gravitycharts/api/chart/options', function ( $response, $feed_id ) {
    $response['plugins']['tooltip'] = [
        'backgroundColor' => 'rgba(0, 0, 0, 0.9)',
        'titleColor'      => '#fff',
        'bodyColor'       => '#fff',
        'borderColor'     => '#666',
        'borderWidth'     => 1,
        'cornerRadius'    => 6,
        'displayColors'   => true,
        'padding'         => 12,
        'boxPadding'      => 6,
    ];

    return $response;
}, 10, 2 );This example has no ID check, so it changes every chart.
gk/gravitycharts/api/chart/data #
This filter changes the data a chart draws: its labels and its datasets.
$chart_data(array): The chart data.$chart_data['labels']holds the labels. Each item in$chart_data['datasets'][0]['data']is an array that holds the number undervalueand its label’s position underx. Itslabelholds the text that the data labels show when Label Text, in the chart’s Labels settings, is Label.$feed(array): The chart’s settings. Its ID,$feed['id'], is a string, so compare it as a number:(int) $feed['id'].$context(string):timelinefor a chart whose Data Type is Show on Timeline, otherwisedefault.
Example: change labels and values
/**
 * Writes chart 5's labels in capitals and adds 10 to each of its values.
 *
 * @param array  $chart_data The chart data.
 * @param array  $feed       The chart's settings.
 * @param string $context    "default", or "timeline" for a chart shown on a timeline.
 *
 * @return array The chart data.
 */
add_filter( 'gk/gravitycharts/api/chart/data', function ( $chart_data, $feed, $context ) {
    if ( 5 !== (int) $feed['id'] ) {
        return $chart_data;
    }

    $chart_data['labels'] = array_map( 'strtoupper', $chart_data['labels'] );

    foreach ( $chart_data['datasets'][0]['data'] as $index => $point ) {
        $chart_data['datasets'][0]['data'][ $index ]['value'] = $point['value'] + 10;
    }

    return $chart_data;
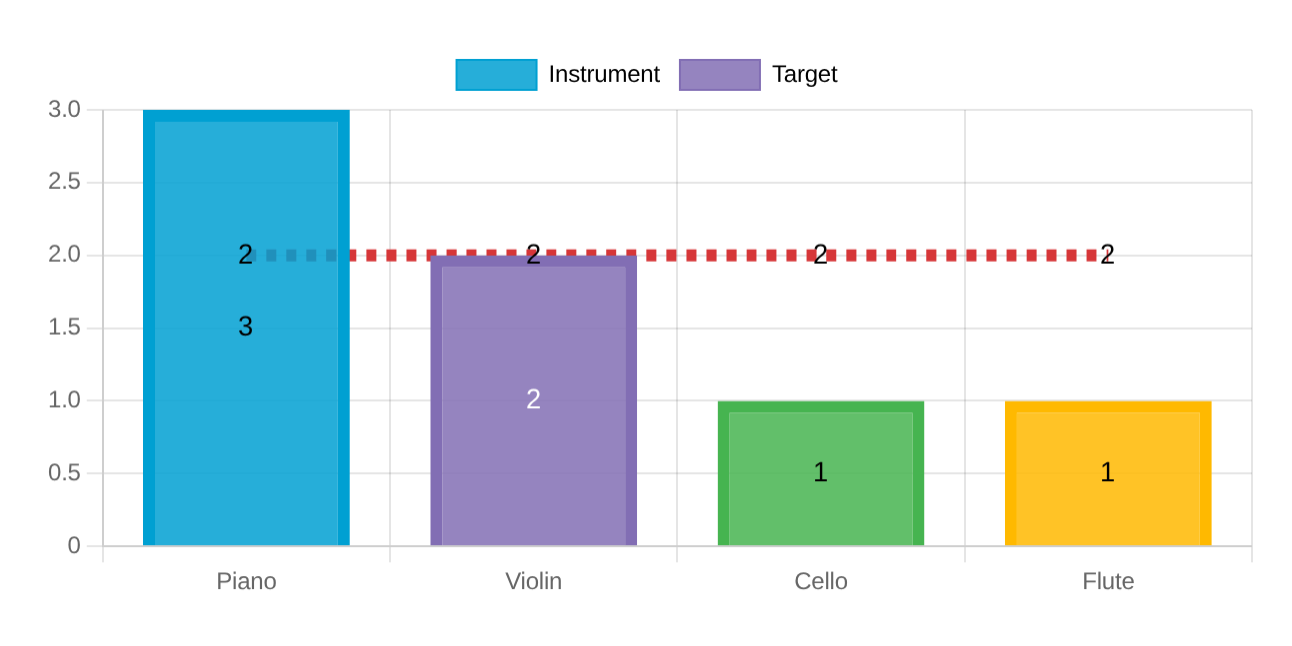
}, 10, 3 );Example: add a target line
/**
 * Draws a dashed target line over chart 5.
 *
 * @param array  $chart_data The chart data.
 * @param array  $feed       The chart's settings.
 * @param string $context    "default", or "timeline" for a chart shown on a timeline.
 *
 * @return array The chart data.
 */
add_filter( 'gk/gravitycharts/api/chart/data', function ( $chart_data, $feed, $context ) {
    if ( 5 !== (int) $feed['id'] || empty( $chart_data['datasets'] ) ) {
        return $chart_data;
    }

    $chart_data['datasets'][] = [
        'label'           => 'Target',
        'data'            => [ 2, 2, 2, 2 ], // One value for each label.
        'type'            => 'line',
        'borderColor'     => '#d63638',
        'backgroundColor' => 'transparent',
        'borderDash'      => [ 5, 5 ],
    ];

    return $chart_data;
}, 10, 3 );Each number in the line’s data is drawn at the label in the same position.
Example: leave out bars below a value
/**
 * Leaves out chart 5's bars whose value is below 2.
 *
 * @param array  $chart_data The chart data.
 * @param array  $feed       The chart's settings.
 * @param string $context    "default", or "timeline" for a chart shown on a timeline.
 *
 * @return array The chart data.
 */
add_filter( 'gk/gravitycharts/api/chart/data', function ( $chart_data, $feed, $context ) {
    if ( 5 !== (int) $feed['id'] ) {
        return $chart_data;
    }

    $minimum = 2;
    $labels  = [];
    $points  = [];

    foreach ( $chart_data['datasets'][0]['data'] as $index => $point ) {
        if ( $point['value'] < $minimum ) {
            continue;
        }

        $point['x'] = count( $points ); // Each point's x is its label's position.
        $labels[]   = $chart_data['labels'][ $index ];
        $points[]   = $point;
    }

    $chart_data['labels']              = $labels;
    $chart_data['datasets'][0]['data'] = $points;

    return $chart_data;
}, 10, 3 );Each kept point gets a new x, so it stays under its own label.
Example: show values with two decimals
A chart of averages labels an average of exactly 4 as 4. These lines write each value with two decimals into its label, so the bars read 4.00. To use them, set Label Text to Label in the chart’s Labels settings.
/**
 * Writes chart 5's values with two decimals for its data labels.
 *
 * @param array  $chart_data The chart data.
 * @param array  $feed       The chart's settings.
 * @param string $context    "default", or "timeline" for a chart shown on a timeline.
 *
 * @return array The chart data.
 */
add_filter( 'gk/gravitycharts/api/chart/data', function ( $chart_data, $feed, $context ) {
    if ( 5 !== (int) $feed['id'] ) {
        return $chart_data;
    }

    foreach ( $chart_data['datasets'][0]['data'] as $index => $point ) {
        $chart_data['datasets'][0]['data'][ $index ]['label'] = number_format( $point['value'], 2 );
    }

    return $chart_data;
}, 10, 3 );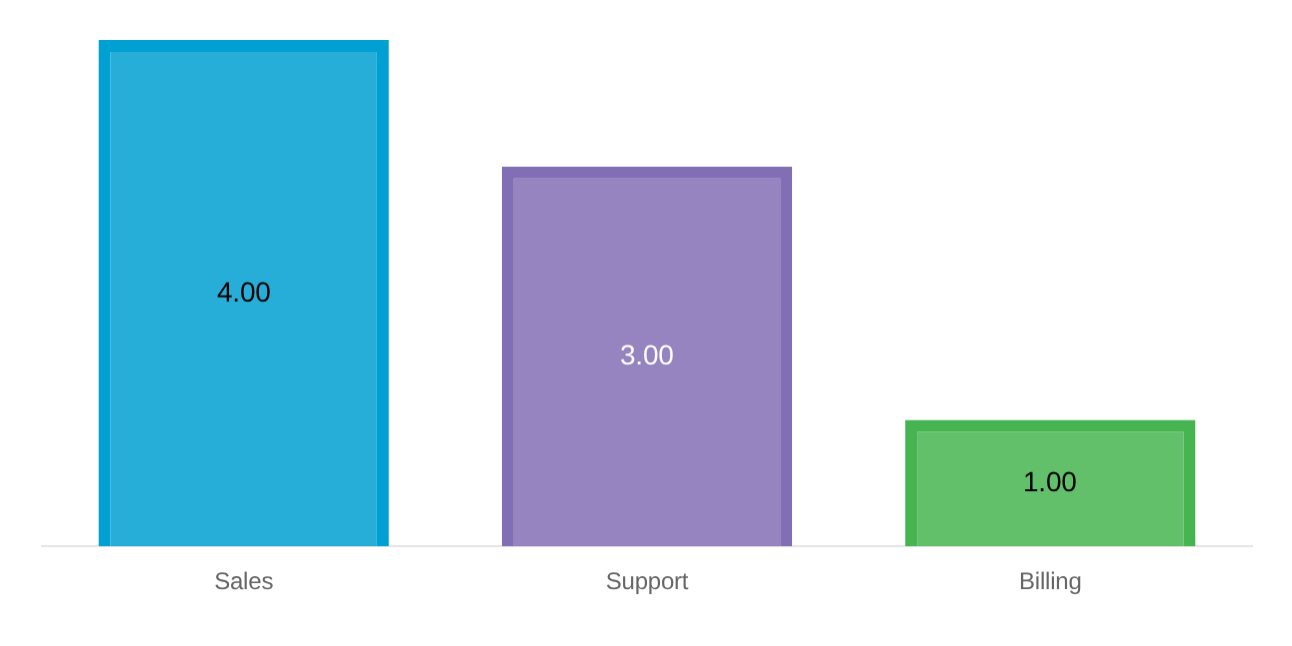
Example: leave out a chart with no data
A chart limited to the signed-in user’s entries, with a Created By condition, draws an empty chart for someone who has none. Returning an empty array leaves the chart off the page.
/**
 * Leaves chart 5 off the page when all of its values are 0.
 *
 * @param array  $chart_data The chart data.
 * @param array  $feed       The chart's settings.
 * @param string $context    "default", or "timeline" for a chart shown on a timeline.
 *
 * @return array The chart data, or an empty array to leave the chart out.
 */
add_filter( 'gk/gravitycharts/api/chart/data', function ( $chart_data, $feed, $context ) {
    if ( 5 !== (int) $feed['id'] ) {
        return $chart_data;
    }

    $values = wp_list_pluck( $chart_data['datasets'][0]['data'] ?? [], 'value' );

    if ( ! array_filter( $values ) ) {
        return [];
    }

    return $chart_data;
}, 10, 3 );This works for a chart added with the [gravitycharts] shortcode or the GravityCharts block.

