
Supported Field Types for GravityCharts Data Sources
A chart’s Data Source, Data Operation, and Data Field settings decide what it plots.
How the three settings fit together #
| Setting | What it does |
|---|---|
| Data Source | The field the chart groups by. Each of its choices becomes a bar, a slice, or a point. |
| Data Operation | What the chart shows for each group: a count of entries, or a sum, average, maximum or minimum. |
| Data Field | The field whose values are aggregated. Only needed when the operation is something other than Entry count. |
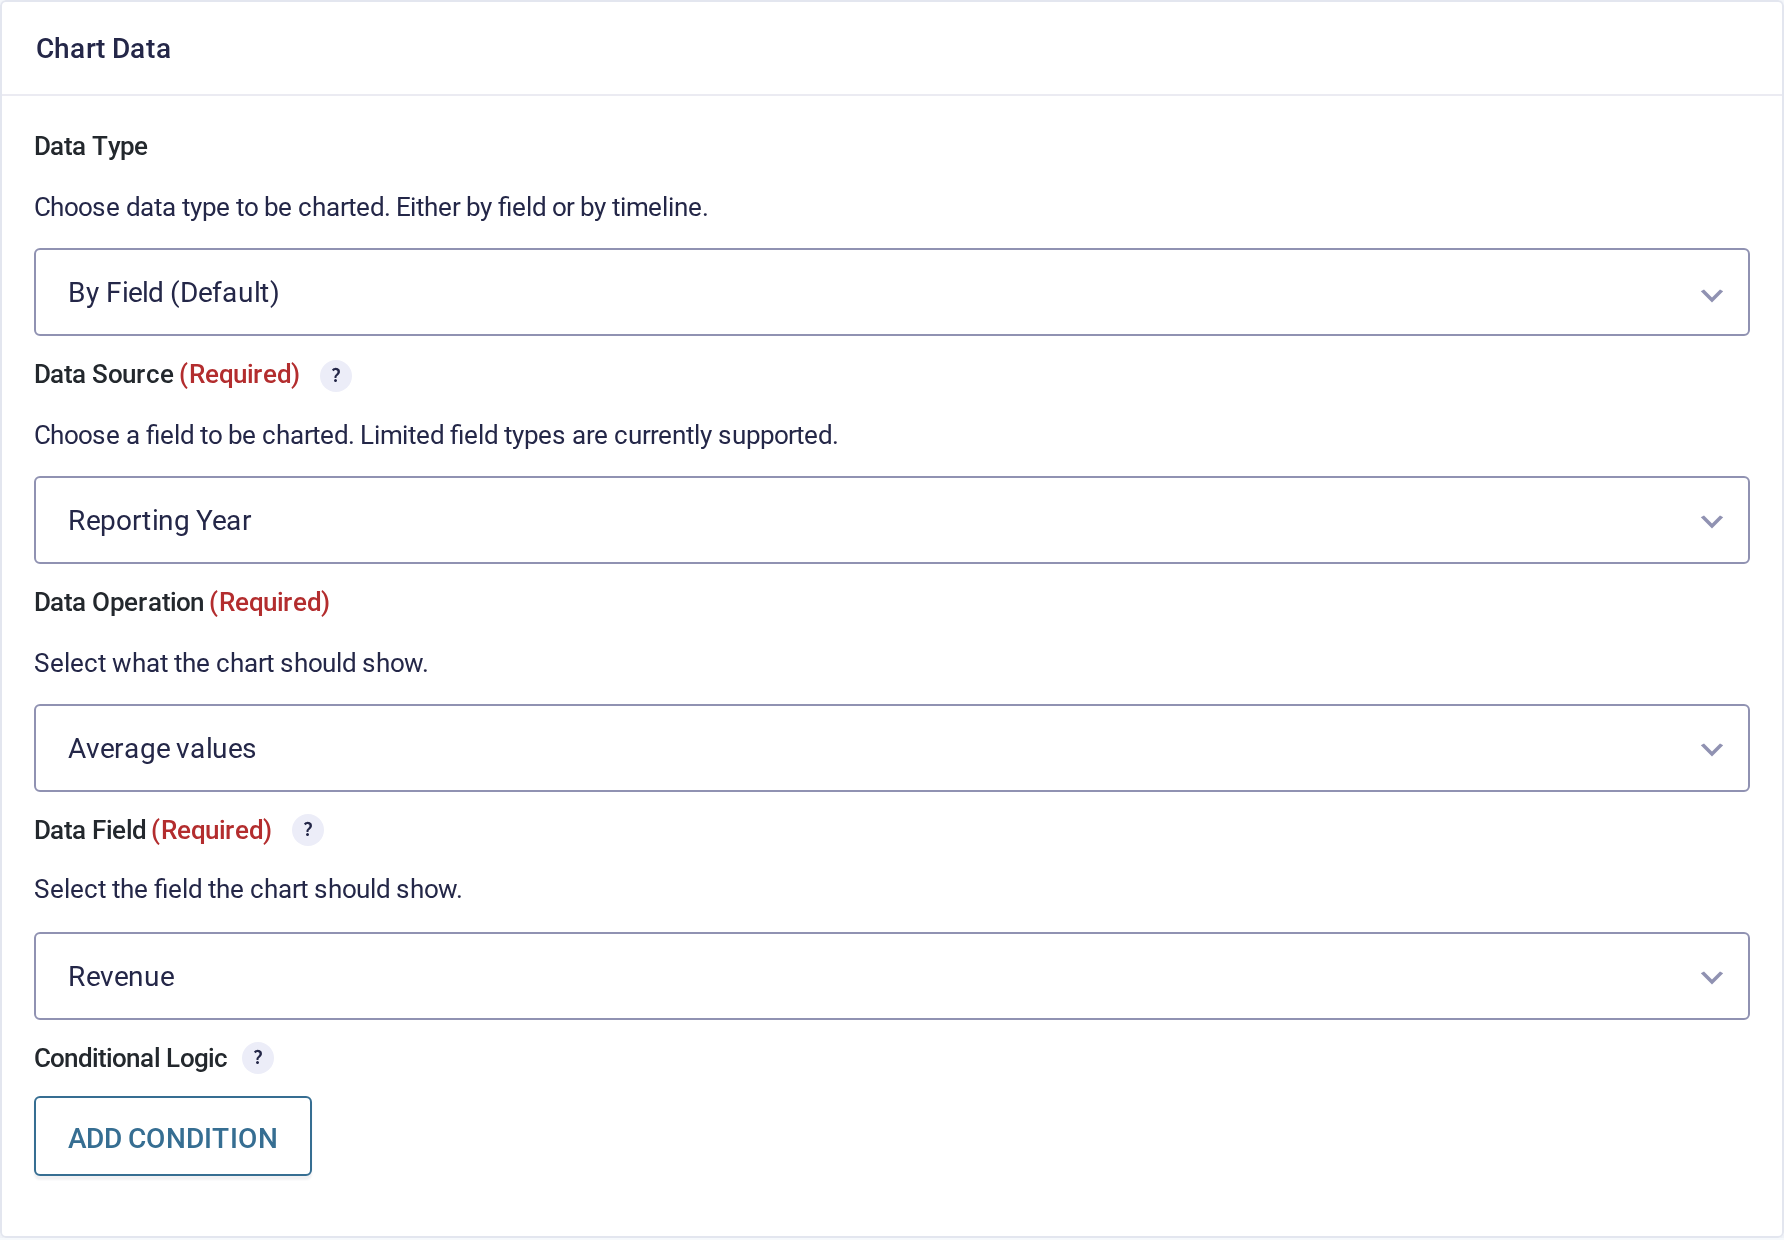
So a chart of average revenue per year uses the Reporting Year field as the Data Source, Average values as the Data Operation, and the Revenue field as the Data Field.
Data Source: which fields can be charted #
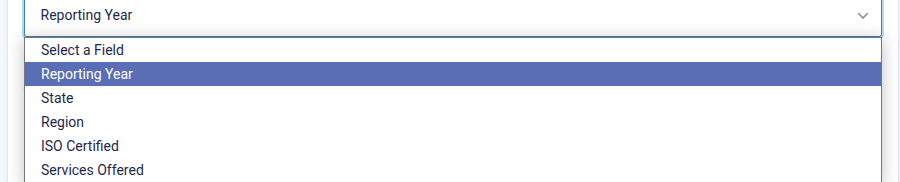
The Data Source has to be a field that offers choices, because those choices are what the chart groups by:
- Drop Down
- Multi-Select Drop Down
- Radio Buttons
- Checkboxes
The same field types from the Survey Add-On, Quiz Add-On (scores are not supported), and Polls Add-On work too. A Dynamic Lookup field with the Dropdown input type is listed once its Enable enhanced user interface setting is on, and the chart names each bar or slice by the name the field shows. Other field types on the form, including Number, Date, and text fields, are not offered in the list.
Warning: Survey Likert fields with multiple rows and Survey Rank fields are not supported.
Note: One chart uses one Data Source. To chart the same form more than one way, create more charts, since one feed produces one chart.
Data Field: Number fields and what else counts #
When the Data Operation is anything other than Entry count, a Data Field appears. This is the field being added up or averaged, and it accepts:
- Number
- Drop Down
- Multi-Select Drop Down
- Radio Buttons
- Checkboxes
- List
Choice-based fields work here when their choice values are numbers. Values that are not numbers are skipped, so they do not count as zero.
A Number field does not need a date field or a timeline. Pair it with any choice-based Data Source and pick the operation you want, and the chart aggregates it directly.
Date field: only for timelines #
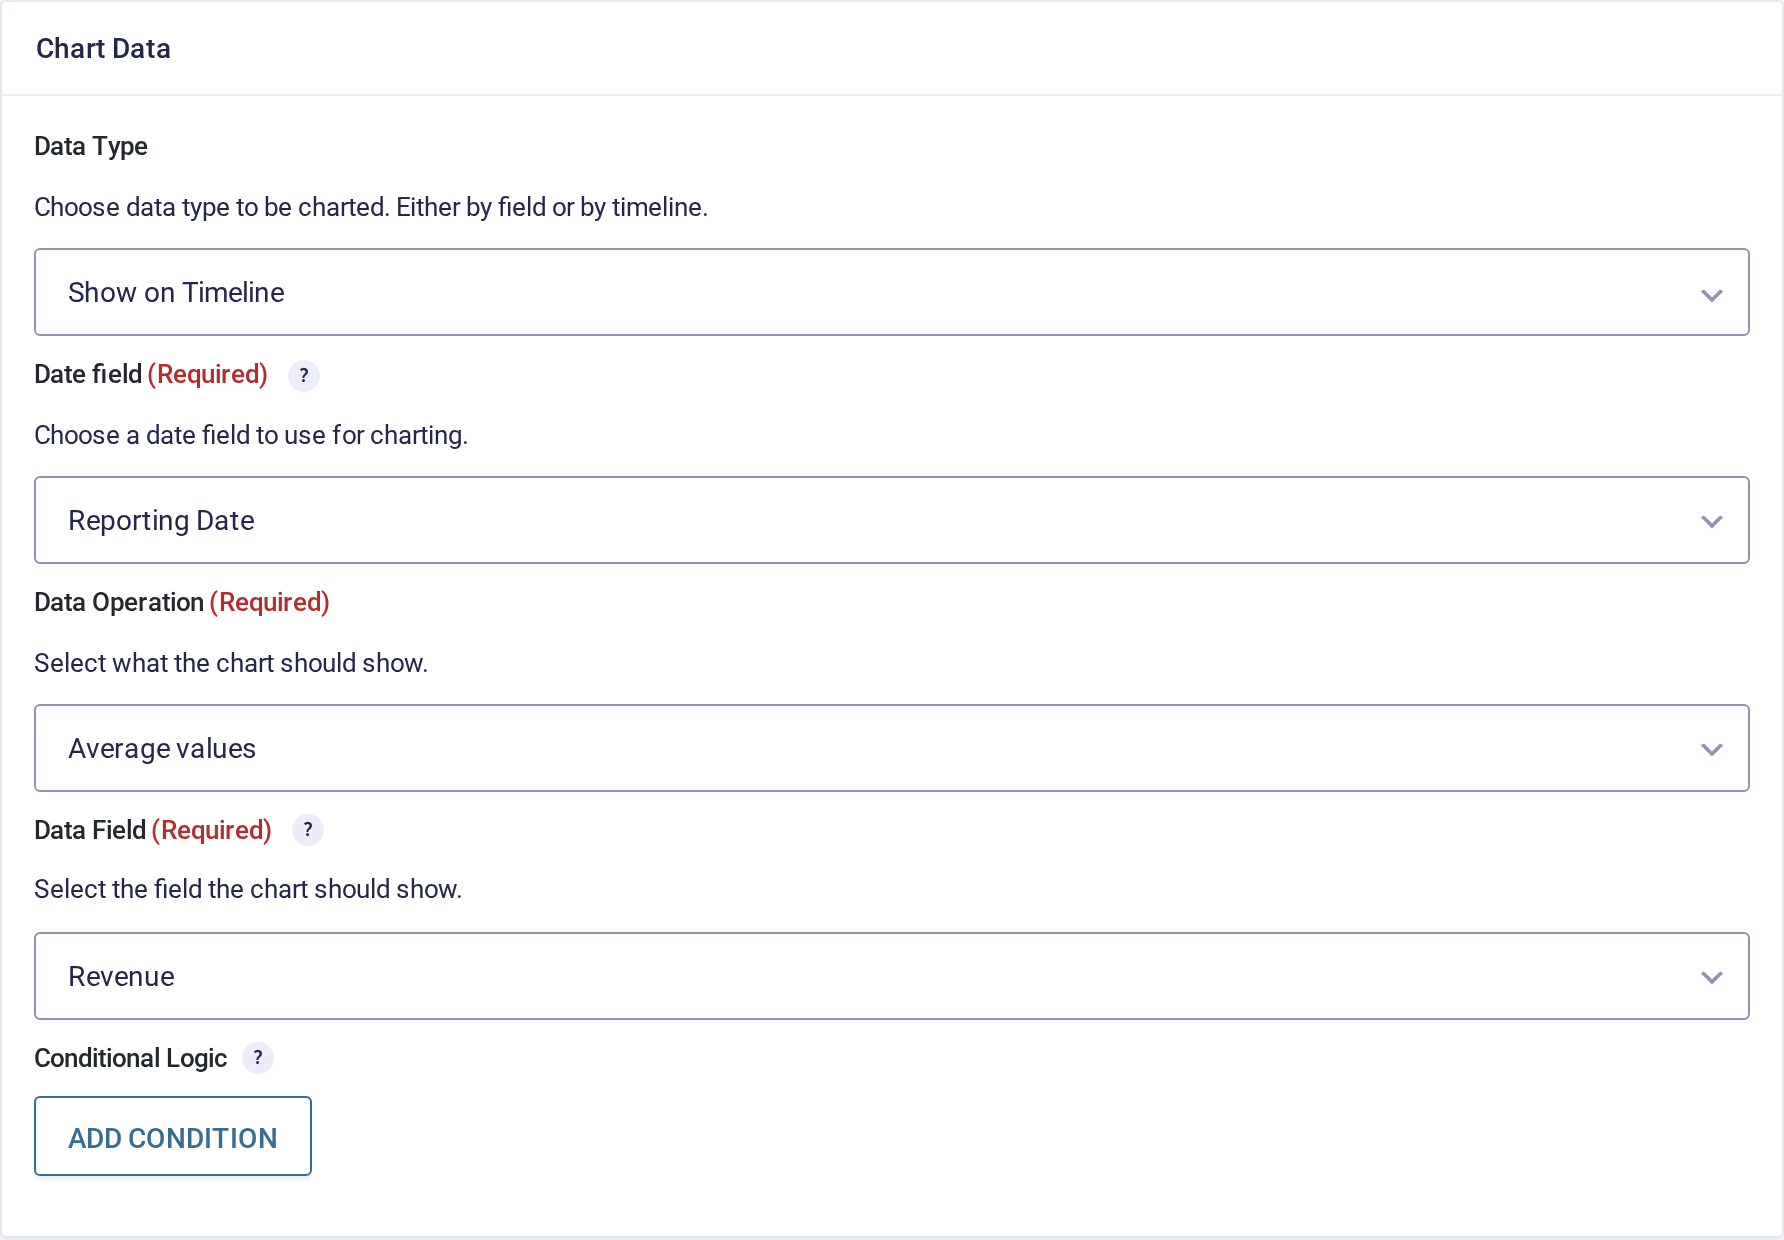
Setting Data Type to Show on Timeline replaces the Data Source with a Date field, which puts dates along the X axis instead of a field’s choices. That setting only accepts Date fields, plus the entry date, and timelines are available on Bar / Column and Line / Area charts.
For the full timeline walkthrough, see Plotting data against time.