

Published
•
Updated
Ecommerce platform market share 2026: WooCommerce leads the web, Shopify leads the top tier
Ecommerce platform market share in 2026, from HTTP Archive data. WooCommerce leads the whole web at 6.30%, but Shopify already leads the top 1M sites.


In our WordPress market share and page builder studies we used the HTTP Archive dataset to size those layers. This post applies the same analysis to ecommerce platform market share: the platforms the web’s online stores actually run on.
The numbers below come from the HTTP Archive Tech Report API and reflect the October 2026 crawl, the latest currently published. Every figure in this post comes from that one dataset.
A note on different numbers from different sources. You will see very different ecommerce market share figures depending on where you look, because they measure different things: some count all websites, some count only sites detected as stores, and detection methods vary. We use HTTP Archive throughout, and state exactly how each number is measured, so the figures here are internally consistent even where they differ from other reports.
Part of our WordPress data studies series: original research on the state of WordPress, refreshed each quarter.
Where the market stands today
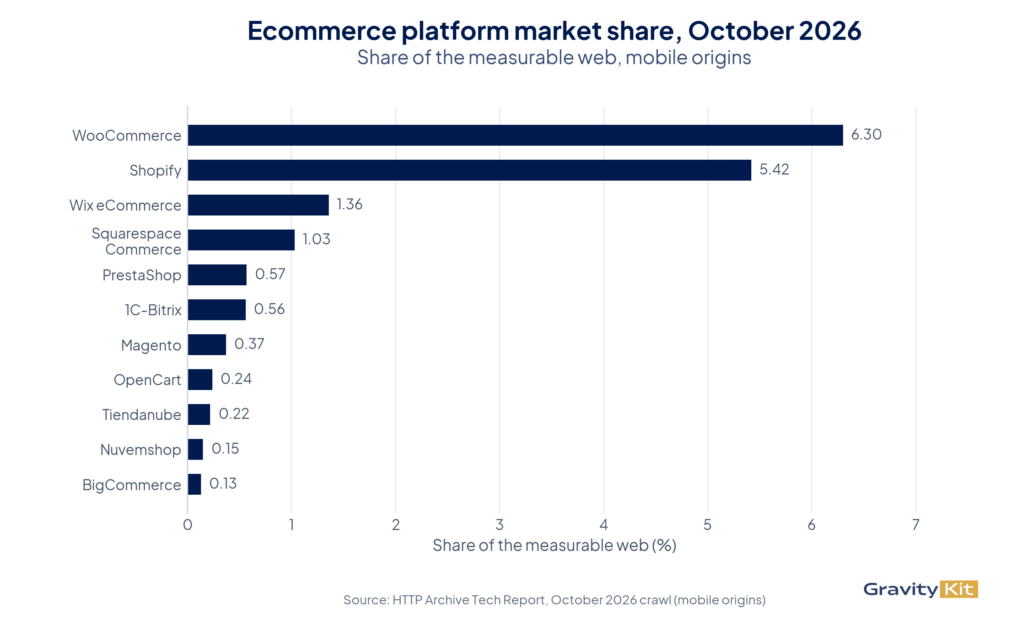
As of October 2026, WooCommerce is detected on 6.30% of all measurable web origins (mobile sample), and Shopify on 5.42%. They are the two largest ecommerce platforms by a wide margin. The next platform, Wix eCommerce, sits at 1.36%.
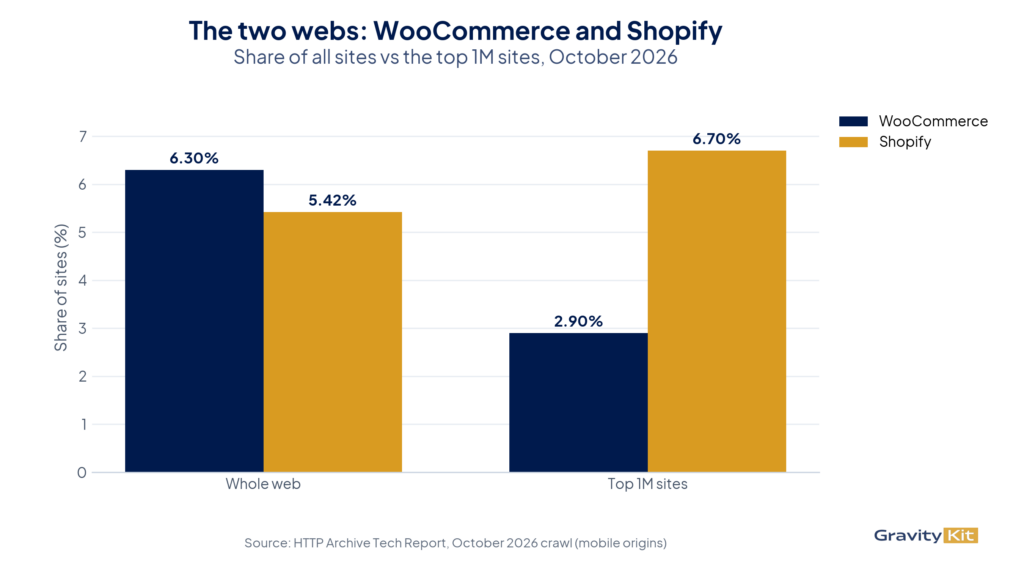
That whole-web ranking does not hold everywhere, though. Among the world’s most-visited sites, the order flips. We come back to that below.
Top ecommerce platforms by share
The table shows each platform two ways: as a share of the whole measurable web, and as a share of the named ecommerce platforms in this set (see methodology for both denominators).
| Rank | Platform | Share of the measurable web | Share of named platforms |
|---|---|---|---|
| 1 | WooCommerce | 6.30% | 37.1% |
| 2 | Shopify | 5.42% | 31.9% |
| 3 | Wix eCommerce | 1.36% | 8.0% |
| 4 | Squarespace Commerce | 1.03% | 6.1% |
| 5 | PrestaShop | 0.57% | 3.3% |
| 6 | 1C-Bitrix | 0.56% | 3.3% |
| 7 | Magento / Adobe Commerce | 0.37% | 2.1% |
| 8 | OpenCart | 0.24% | 1.4% |
| 9 | Tiendanube | 0.22% | 1.3% |
| 10 | Nuvemshop | 0.15% | 0.9% |
| 11 | BigCommerce | 0.13% | 0.8% |
A long tail of smaller, mostly regional platforms rounds out the field, including Shoptet, Square Online, Salla, Cafe24, Shopline, Shopware, and Ecwid, each around 0.1% of the web or less.
The two webs: whole web vs the top 1M
On the whole web, WooCommerce leads Shopify by a factor of 1.16x (6.30% vs 5.42%). Narrow the sample to the most popular sites (HTTP Archive’s top-1M popularity tier from the Chrome UX Report) and the order reverses: Shopify holds 6.70% and WooCommerce 2.90%, a Shopify lead of about 2.31x.
A closer look at WooCommerce and Shopify
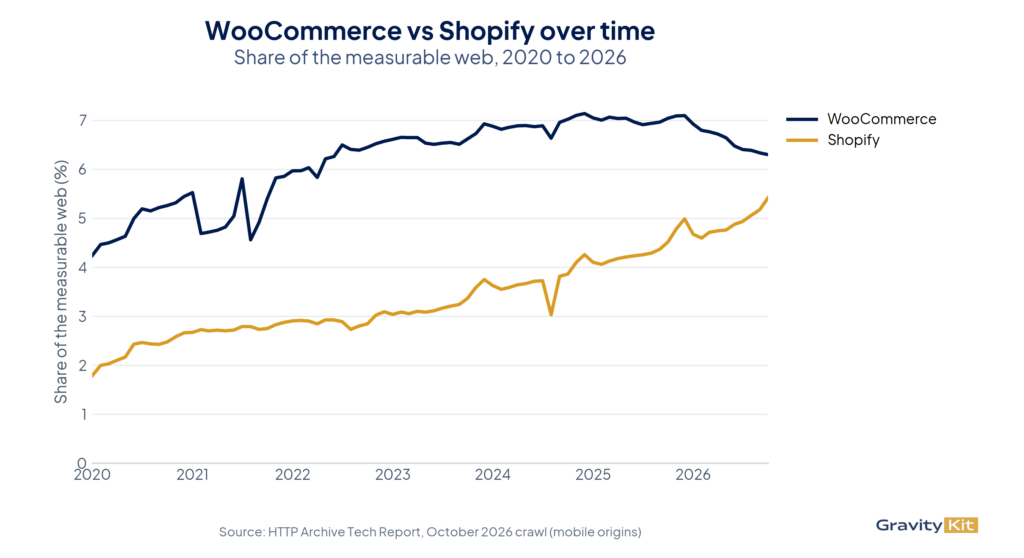
Over the 2020 to 2026 window, WooCommerce’s share of the measurable web climbed to a plateau above 7% from late 2024 to late 2025 and has fallen to 6.30% since. Shopify’s share rose steadily over the same period, from about 1.8% in early 2020 to 5.42% today.
The rest of the field over time
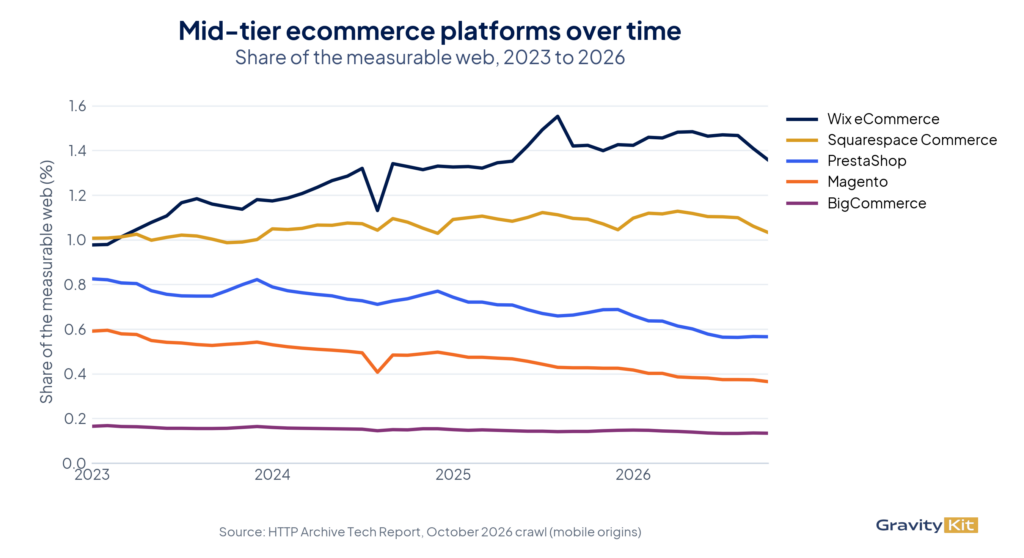
Among the mid-tier platforms, the movements since 2023 split in two directions. Wix eCommerce rose from about 1.0% to 1.36% of the web, and Squarespace Commerce edged up. PrestaShop fell from about 0.82% to 0.57%, Magento from about 0.59% to 0.37%, and BigCommerce edged down from about 0.17% to 0.13%.
Which platforms grew and shrank
Measured by year-over-year change in detected origins (October 2025 to October 2026), among the largest platforms Shopify grew fastest at +11.8%. It is the only large platform that grew. Every other one lost origins over the year: Wix eCommerce −11.0%, Squarespace Commerce −11.8%, WooCommerce −16.6%, 1C-Bitrix −16.7%, Magento −20.4%, and PrestaShop −21.8%. Part of that is the sample itself: the number of measurable sites fell 6.8% over the same year.
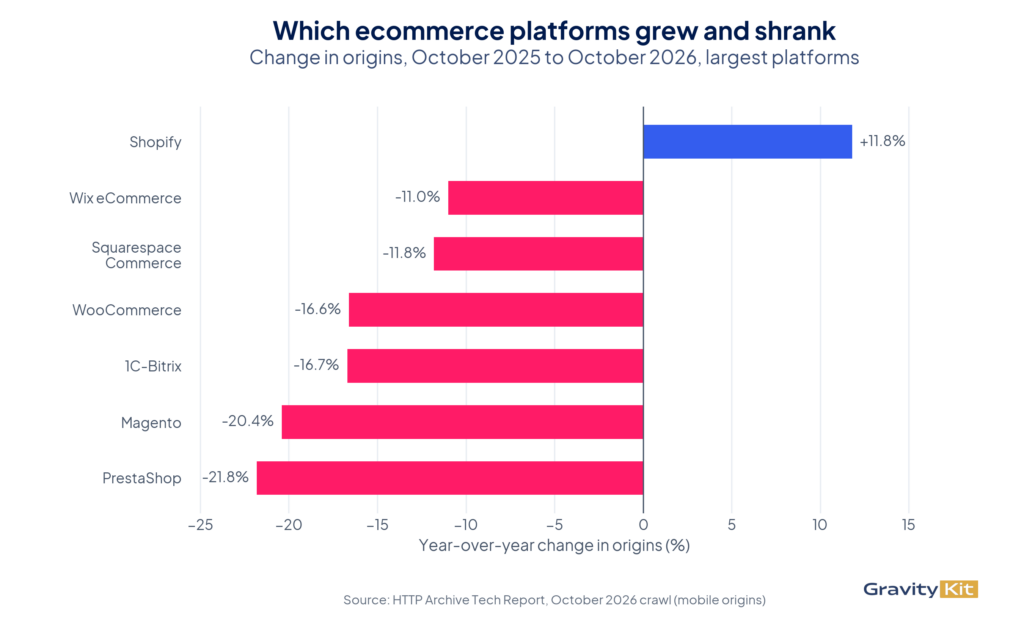
Among the largest platforms, Shopify is the only one growing at scale. The other year-over-year gainers are smaller, mostly regional platforms.
How much of the web is a store
Beyond the named platforms, HTTP Archive detects generic cart or checkout functionality on 20.2% of all measurable sites, so roughly one in five sites has some form of store. This is a broad signal that overlaps the platforms above: a WooCommerce or Shopify store is also counted here. For that reason we report it on its own, and never use it as a share denominator.
How we measured, and an important caveat
The HTTP Archive is not a census of every store. It measures sites in the Chrome User Experience Report, so very low-traffic and private sites are excluded, and it depends on platform fingerprints, so a newer or obscure platform can be undercounted. We think a single transparent method is the right call for a study like this, but it measures a defined sample, not the entire internet.
Methodology
- Data source – HTTP Archive Tech Report API, October 2026 crawl.
- Sample – Mobile origins in the Chrome User Experience Report (CrUX), roughly 8.5 million sites worldwide with enough Chrome traffic to be statistically measured.
- Detection – HTTP Archive’s Wappalyzer fork, Ecommerce category, detection on each origin’s home page and one interior page.
- YoY comparisons – October 2026 vs. October 2025 mobile origin counts.
- Share calculations – Two denominators. Share of the measurable web is a platform’s mobile origin count divided by
technology=ALLmobile origins for the same month. Share of named platforms is a platform’s mobile origins divided by the sum of the named ecommerce platforms in this study, same month. - Cart functionality – Reported separately as the share of sites with any detected cart or checkout. It overlaps the named platforms and is never used as a denominator.
- Chart cleaning – A few documented detection-glitch months are interpolated in the time-series charts only: WooCommerce’s Sept and Oct 2021 readings (which briefly collapsed to near zero). A smaller mobile-crawl dip in Aug 2024 is shown as measured.
- Amazon Webstore – Excluded from the platform rankings and from the named-platform denominator. Its detection rests only on a JavaScript variable that Amazon’s advertising tag also sets, and Amazon discontinued the product in 2016, so these detections don’t represent live stores.
- Detection granularity – Wix eCommerce and Squarespace Commerce are detected at the platform level rather than the store level, so both figures likely overstate active stores. Treat them as upper bounds.
- pp – Percentage points. A change from 4.52% to 5.42% is +0.90 pp.
We refresh these numbers quarterly. To catch the next quarterly update, subscribe to the GravityKit newsletter.

Get better at Gravity Forms, one email a week
New GravityKit releases, practical Gravity Forms tutorials, and subscriber-only discounts. One short email every week, unsubscribe anytime.
More articles

Launch Log: Lookup fields that filter each other, a Clear link for each Live Filter, and more
Dynamic Lookup fields that filter each other, a Clear link for each Live Filter, Edit Window closed text, and security fixes across GravityView and more.

Black Friday is coming: 25% off GravityView Pro, All Access and Lifetime
Our Black Friday sale runs November 23 to December 1, with 25% off GravityView Pro, the All Access Pass, and Lifetime. Join the list to get in four days early.

Launch Log: GravityView Pro, paid featured tiers, and a “Pages with this View” menu
GravityView Pro arrives with paid and ranked Featured Tiers, GravityView adds a Pages with this View menu and Welcome page, plus several security fixes.