Published
•
Updated
WordPress powers 33% of the web in 2026 (down from 36% at its peak): CMS market share report
Updated WordPress CMS market share figures using HTTP Archive data, picking up where Joost de Valk's foundational research left off.

For years, the canonical answer to “how much of the web runs on WordPress?” has come from Joost de Valk’s CMS market share research. His work, plus the open-source pull requests to the HTTP Archive’s Wappalyzer fork that made the underlying detection better, set the methodological foundation that many sources rely on.
This post is a straightforward refresh using the same HTTP Archive dataset Joost uses, pulled in May 2026. The numbers below come from the HTTP Archive Tech Report API and reflect the April 2026 crawl, which is the latest currently published.
A note on different numbers from different sources. If you’ve read that WordPress powers ~43% of the web (W3Techs) or ~33% (HTTP Archive), both are technically right, but they’re measuring different things. W3Techs counts subdomains of a site as a single entry; HTTP Archive counts them separately. HTTP Archive’s measurement is also limited to sites in the Chrome User Experience Report (CrUX), so very low-traffic sites are excluded. We use HTTP Archive throughout this post because it’s the methodology Joost’s research is built on.
Part of our WordPress data studies series: original research on the state of WordPress, refreshed each quarter.
Where WordPress stands today
As of April 2026, WordPress is detected on 33.21% of all measurable web origins (mobile sample). It remains the most-used CMS by a wide margin. Shopify, the #2 platform, sits at 4.74%.
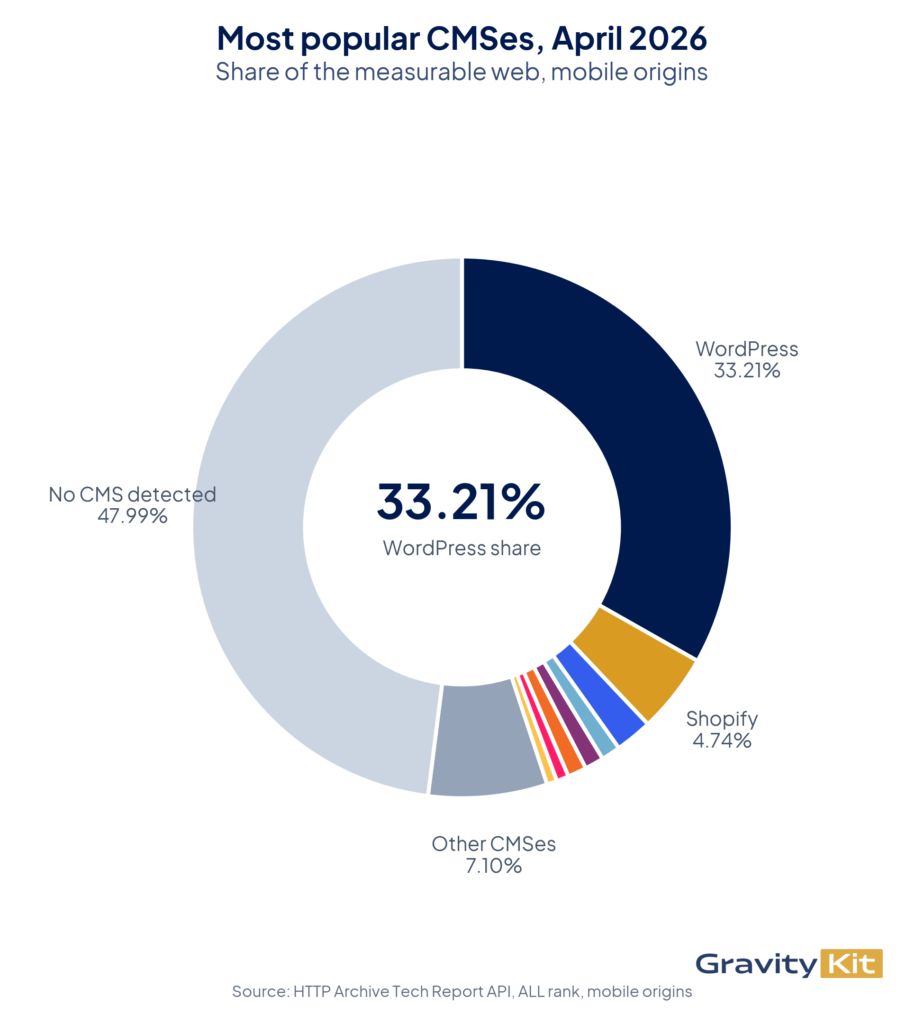
48.3% of the measurable web doesn’t use a CMS that HTTP Archive can detect. That bucket includes static sites, headless setups, hand-built pages, and any platform that lacks a Wappalyzer fingerprint. We come back to that slice at the end of the post.
Top 10 CMSes by share
| Rank | CMS | Share of measurable web | YoY Δ (pp) | YoY origin growth |
|---|---|---|---|---|
| 1 | WordPress | 33.21% | −0.93 | −3.7% |
| 2 | Shopify | 4.74% | +0.57 | +12.4% |
| 3 | Wix | 2.21% | +0.02 | +0.1% |
| 4 | Drupal | 1.14% | −0.13 | −11.0% |
| 5 | Joomla | 1.14% | −0.18 | −14.6% |
| 6 | Squarespace | 1.13% | +0.03 | +2.2% |
| 7 | Webflow | 0.73% | +0.05 | +6.7% |
| 8 | PrestaShop | 0.61% | −0.10 | −14.4% |
| 9 | Tilda | 0.61% | −0.004 | −1.5% |
| 10 | 1C-Bitrix | 0.59% | −0.07 | −11.0% |
Among the top 10, four CMSes gained share over the last year (Shopify, Wix, Squarespace, Webflow) and six lost share (WordPress, Drupal, Joomla, PrestaShop, Tilda, 1C-Bitrix).
How the top 10 have moved over time
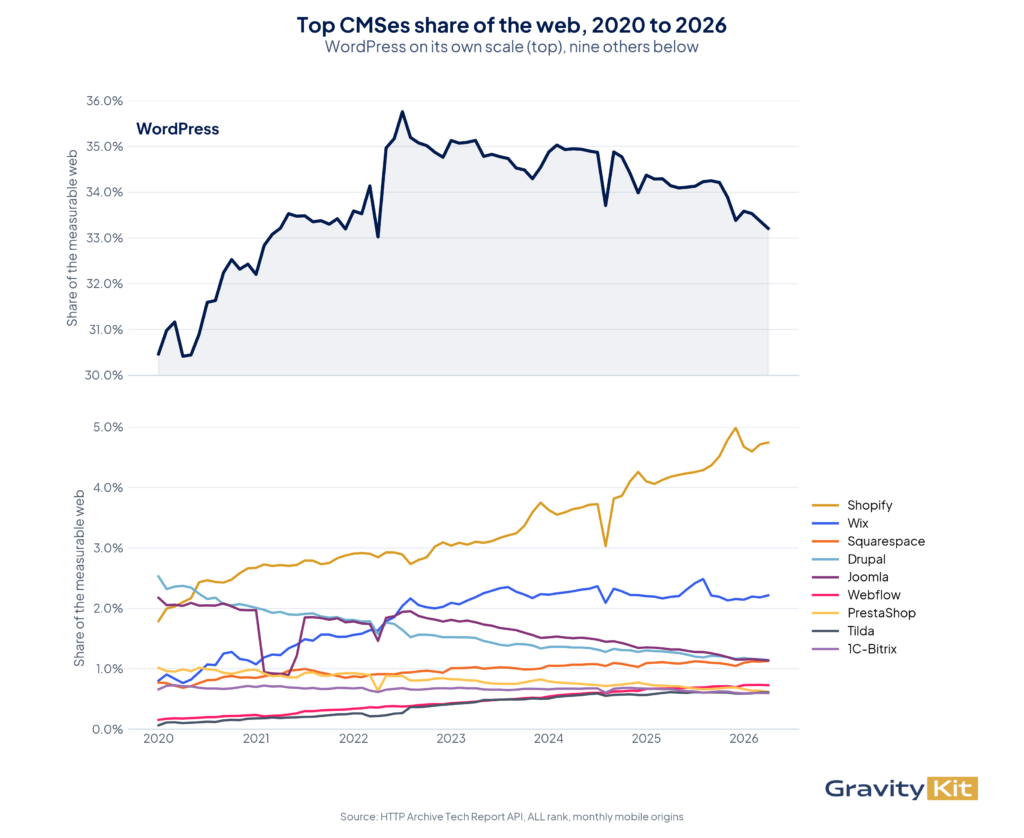
A few patterns visible in the chart:
- WordPress climbed steadily from 30.5% in early 2020 through mid-2022, then turned downward
- Shopify has been climbing on its own consistent curve since 2020
- Drupal, Joomla, and PrestaShop have all been trending down over the full period
- Wix and Squarespace are roughly flat
- Webflow, Duda, and other modern site builders are small but growing
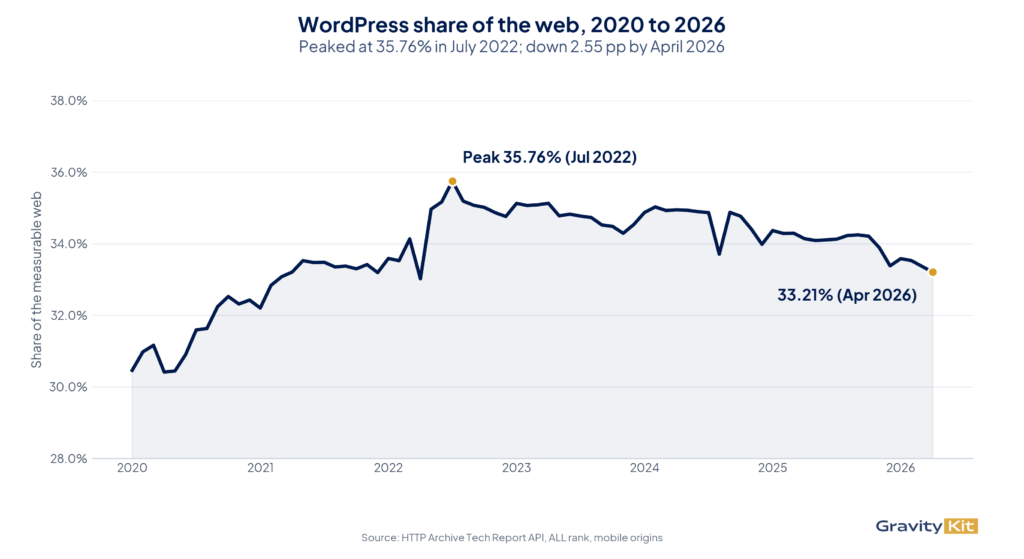
A closer look at WordPress
WordPress hit its all-time high of 35.76% in July 2022, then began a slow decline. Today’s 33.21% is 2.55 percentage points below that peak, or roughly a 7% relative decline over ~4 years.
Top 10 fastest-growing CMSes
These aren’t the biggest CMSes, but they’re the ones whose origin counts grew fastest year-over-year (filtered to platforms with at least 5,000 detected origins, so the percentages aren’t driven by tiny bases).
| Rank | CMS | Current origins | YoY origin growth | Share Δ (pp) |
|---|---|---|---|---|
| 1 | Backdrop | 5,148 | +164.5% | +0.036 |
| 2 | Framer Sites | 11,226 | +85.0% | +0.058 |
| 3 | Sanity | 7,898 | +48.4% | +0.029 |
| 4 | Odoo | 9,173 | +30.3% | +0.025 |
| 5 | Wagtail | 6,178 | +25.9% | +0.015 |
| 6 | Shopify | 423,209 | +12.4% | +0.566 |
| 7 | Duda | 45,029 | +8.5% | +0.044 |
| 8 | Webflow | 64,732 | +6.7% | +0.052 |
| 9 | GoDaddy Website Builder | 21,144 | +4.0% | +0.011 |
| 10 | Skolengo | 9,118 | +3.0% | +0.004 |
Shopify is the only platform in this list growing at scale. Every other entry has a substantially smaller base. In percentage-point terms, Shopify alone gained more share of the measurable web (+0.566 pp) than the other nine combined (+0.273 pp).
Where the lost share went
Over the year between April 2025 and April 2026, WordPress lost 0.93 percentage points of web share. The total share gained by all other CMSes that grew over the same period adds up to roughly 0.96 percentage points (almost an exact match).
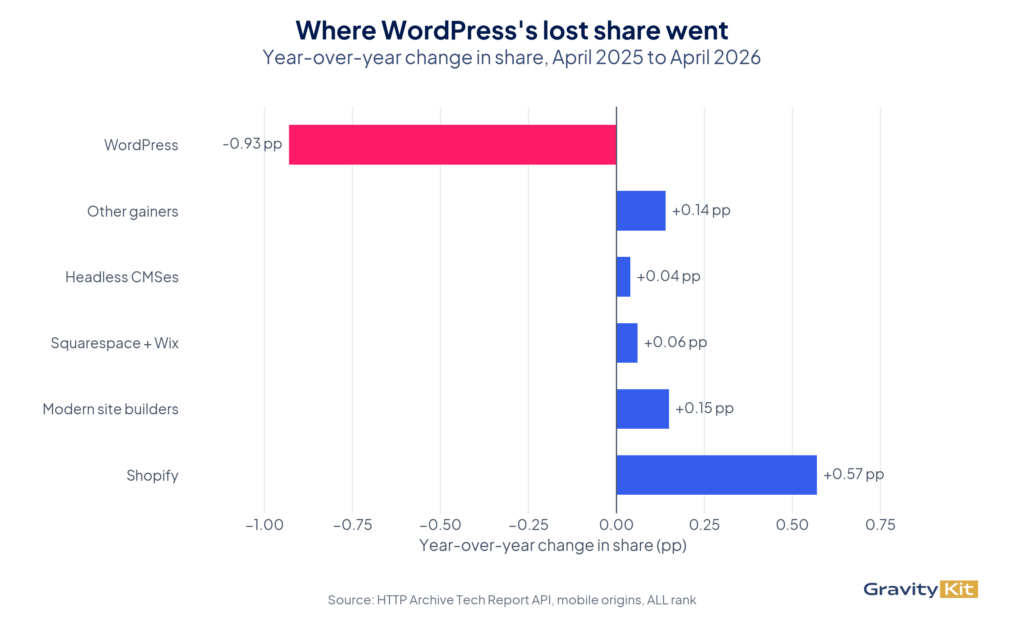
Of that 0.96 pp of new share captured by other CMSes:
- Shopify took ~59% (+0.57 pp)
- Modern site builders (Framer, Webflow, Duda) took ~16% combined (+0.15 pp)
- Squarespace + Wix picked up ~6% (+0.06 pp)
- Headless CMSes (Sanity, Wagtail) picked up ~4% (+0.04 pp)
- The remaining ~15% spread across other gainers (Backdrop, Odoo, GoDaddy Website Builder, Skolengo, plus a long tail of small CMSes that each grew by less than 0.01 pp)
The “no CMS detected” slice
The share of the measurable web running on something HTTP Archive can detect as a CMS has shifted only slightly over the last few years. In April 2026, 48.3% of measurable origins didn’t have a detected CMS at all, up from a low of 46.75% in mid-2024.
“No CMS detected” is not the same as “no CMS used.” It includes:
- Sites built with headless / Jamstack architectures (Next.js, Astro, Hugo, Eleventy) where the rendered HTML carries no CMS fingerprint
- Hand-coded sites
- Static exports
- Newer platforms that don’t yet have Wappalyzer detection rules
We don’t draw any further conclusion here, but if you’re comparing CMS-share numbers across sources, the denominator matters: WordPress’s share of just the detected-CMS subset is ~64%, more than every other detected CMS combined.
Methodology
- Data source – HTTP Archive Tech Report API, April 2026 crawl.
- Sample – Mobile origins in the Chrome User Experience Report (CrUX), roughly 8.9 million sites worldwide with enough Chrome traffic to be statistically measured.
- Detection – HTTP Archive’s Wappalyzer fork, with detection on each origin’s homepage.
- YoY comparisons – April 2026 vs. April 2025 origin counts.
- Share calculation – A CMS’s mobile origin count divided by
technology=ALLmobile origins for the same month. - Caveats – HTTP Archive’s measurement is limited to the CrUX sample (so low-traffic and private sites are excluded) and to platforms with a Wappalyzer fingerprint (so newer or obscure CMSes may be undercounted or missing entirely).
We plan to refresh these numbers monthly. Our methodology was inspired by Joost’s original research. Credit where it’s due!
Want to know when we publish the next refresh? Subscribe to our newsletter for timely updates.

Helpful tips right in your inbox.
Subscribe to get the latest articles, information on releases and helpful Gravity Forms tips!
More articles

Launch Log: Row headers for screen readers, smarter conditional logic, and multi-View fixes
GravityView 3.1 adds row headers for screen readers, plus smarter conditional logic in GravityCalendar and fixes for DataTables, Maps, and Dynamic Lookup.

Ecommerce platform market share 2026: WooCommerce leads the web, Shopify leads the top tier
Ecommerce platform market share in 2026, from HTTP Archive data. WooCommerce leads the whole web at 6.64%, but Shopify already leads the top 1M sites.

Launch Log: 3D map enhancements, smarter filtering, and improved performance on large data sets
GravityKit’s July 9 launch log: 3D map starting views and viewport loading, searchable field-to-field filtering, and fixes across DataTables and more.