
Last updated:
WordPress data & statistics 2026
How much of the web runs on WordPress, how that share is changing, and what actually powers WordPress sites, measured with first-party HTTP Archive data and refreshed every quarter.
Primary source: HTTP Archive
Refreshed quarterly

WordPress stats at a glance
33.2%
Of all measurable web origins run WordPress
Source: HTTP Archive, April 2026
35.8%
WordPress’s peak share, reached in July 2022 (now 33.21%)
Source: HTTP Archive
~64%
Of all sites with a detectable CMS run WordPress
Source: HTTP Archive, April 2026
32.7%
Of WordPress sites are built with Elementor, the top page builder
Source: HTTP Archive, April 2026
Quick facts
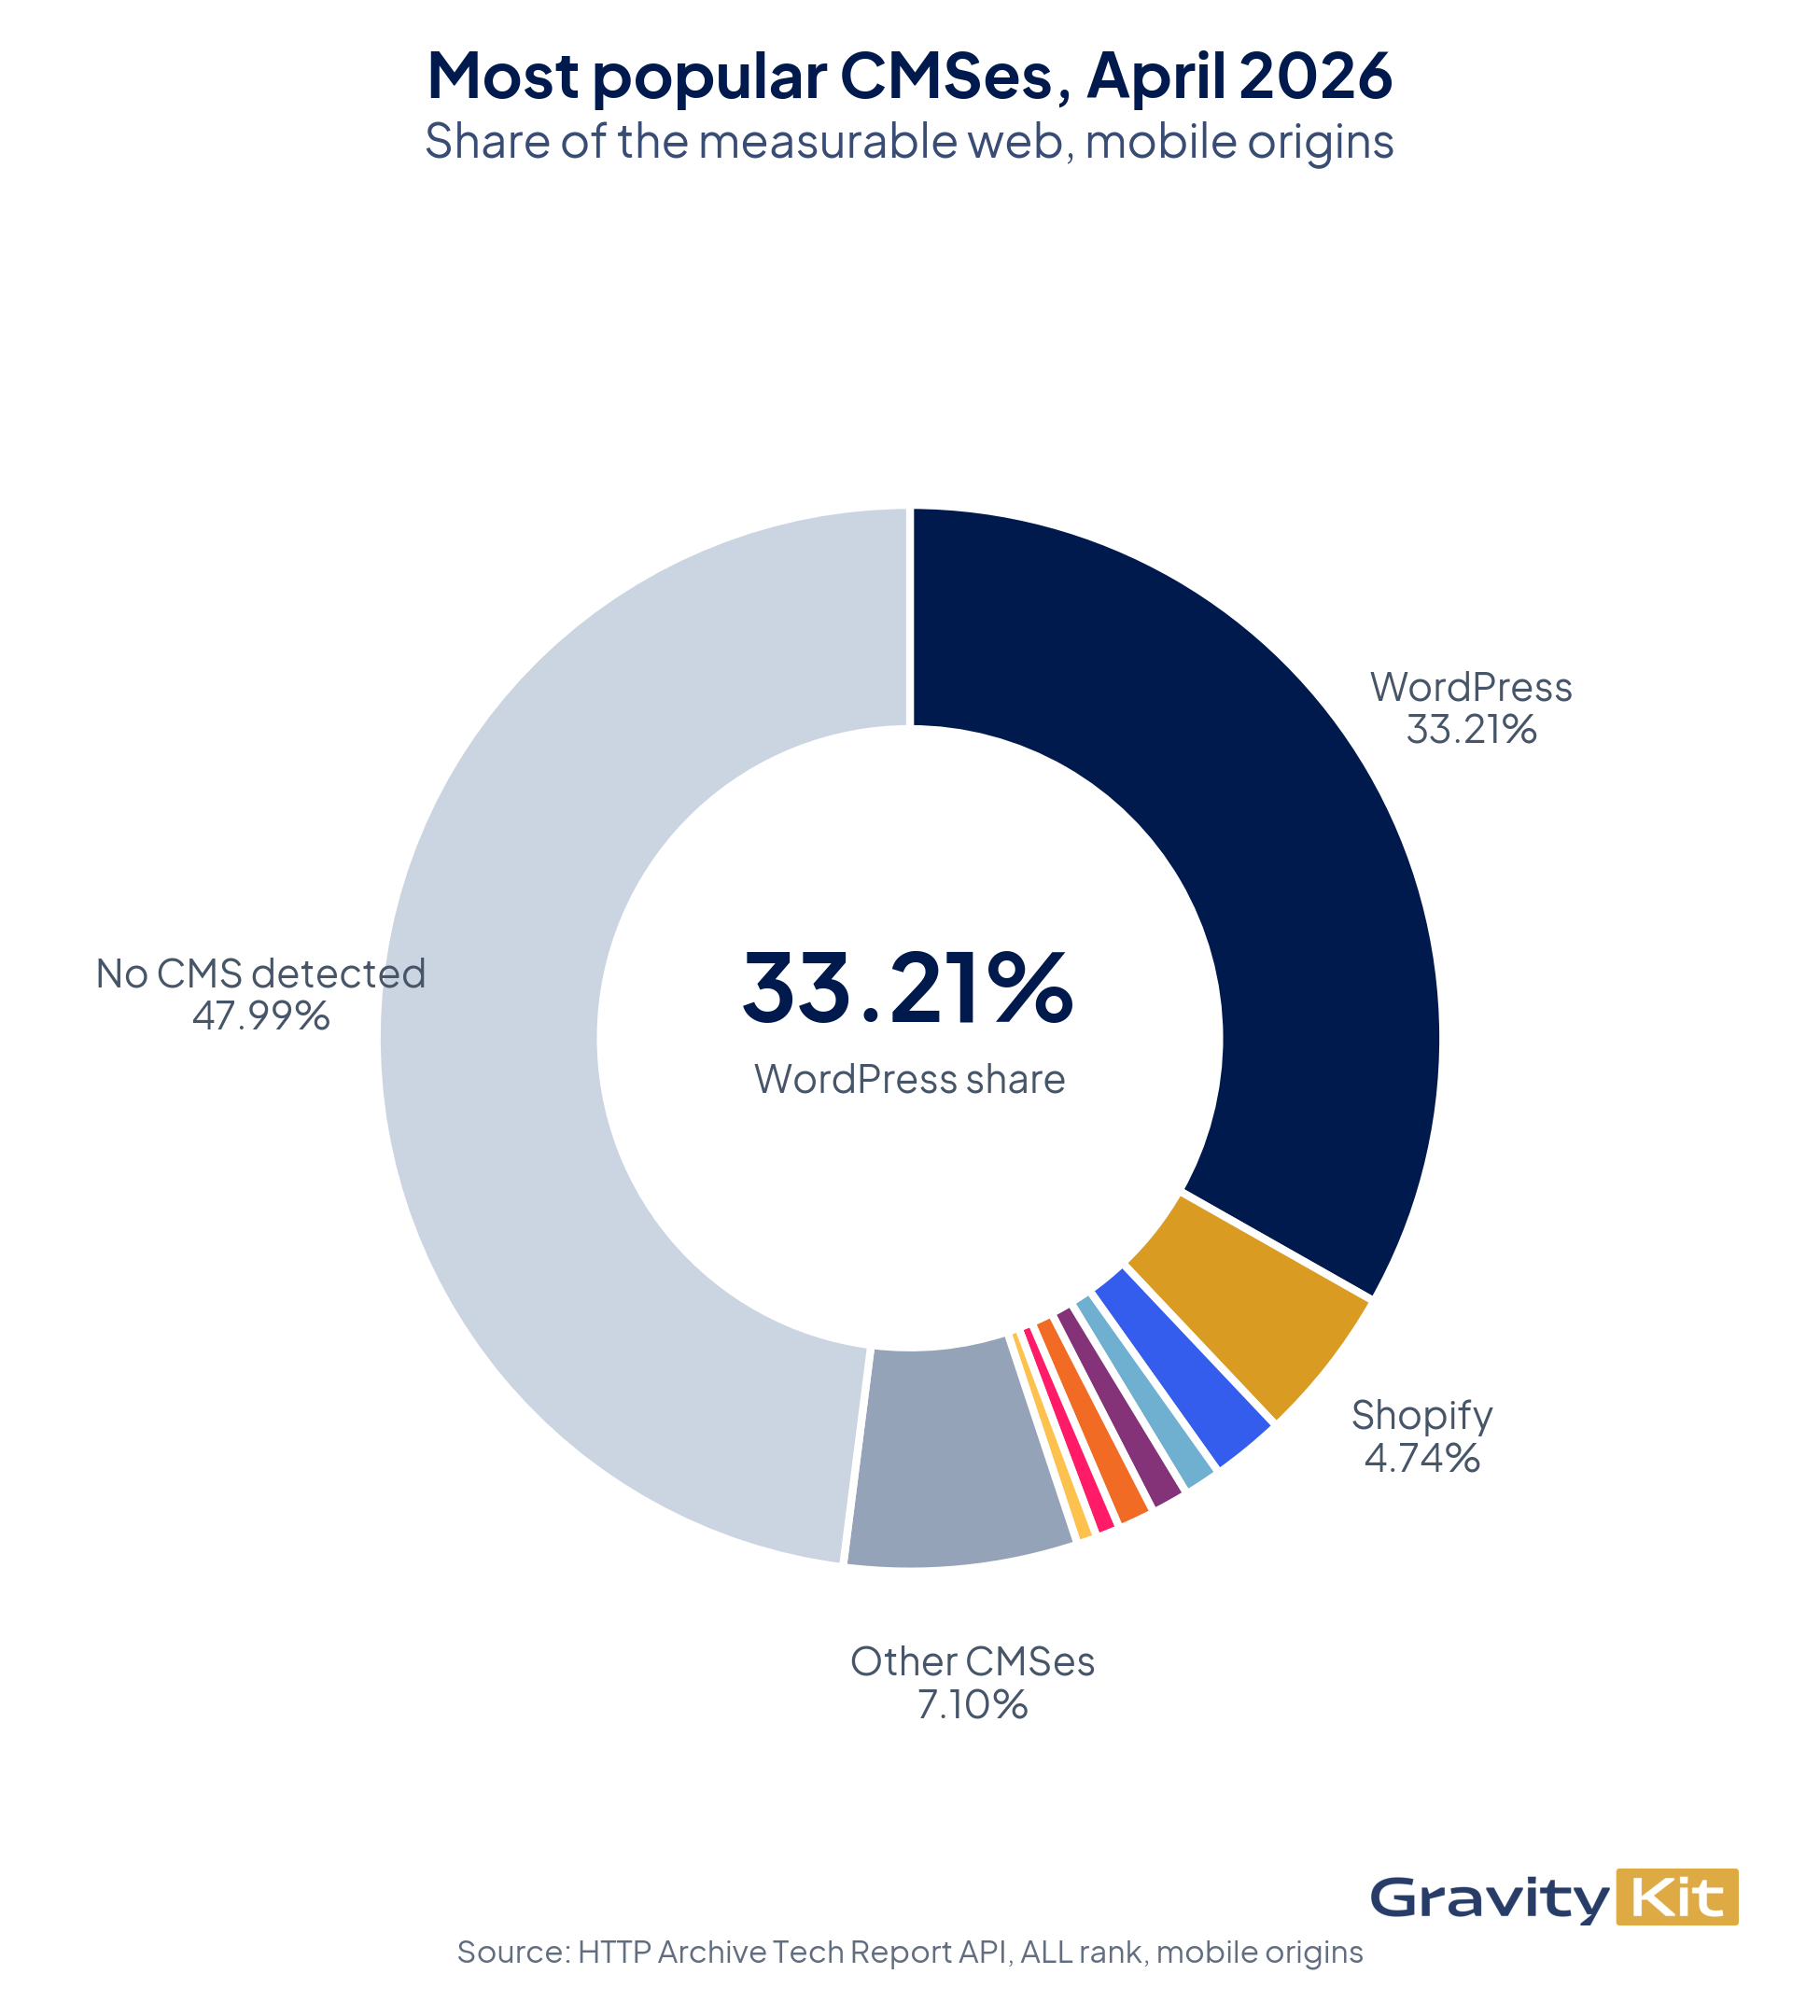
- WordPress runs 33.21% of all measurable web origins as of April 2026, and about 64% of all sites that use a detectable CMS, more than every other CMS combined. (Source)
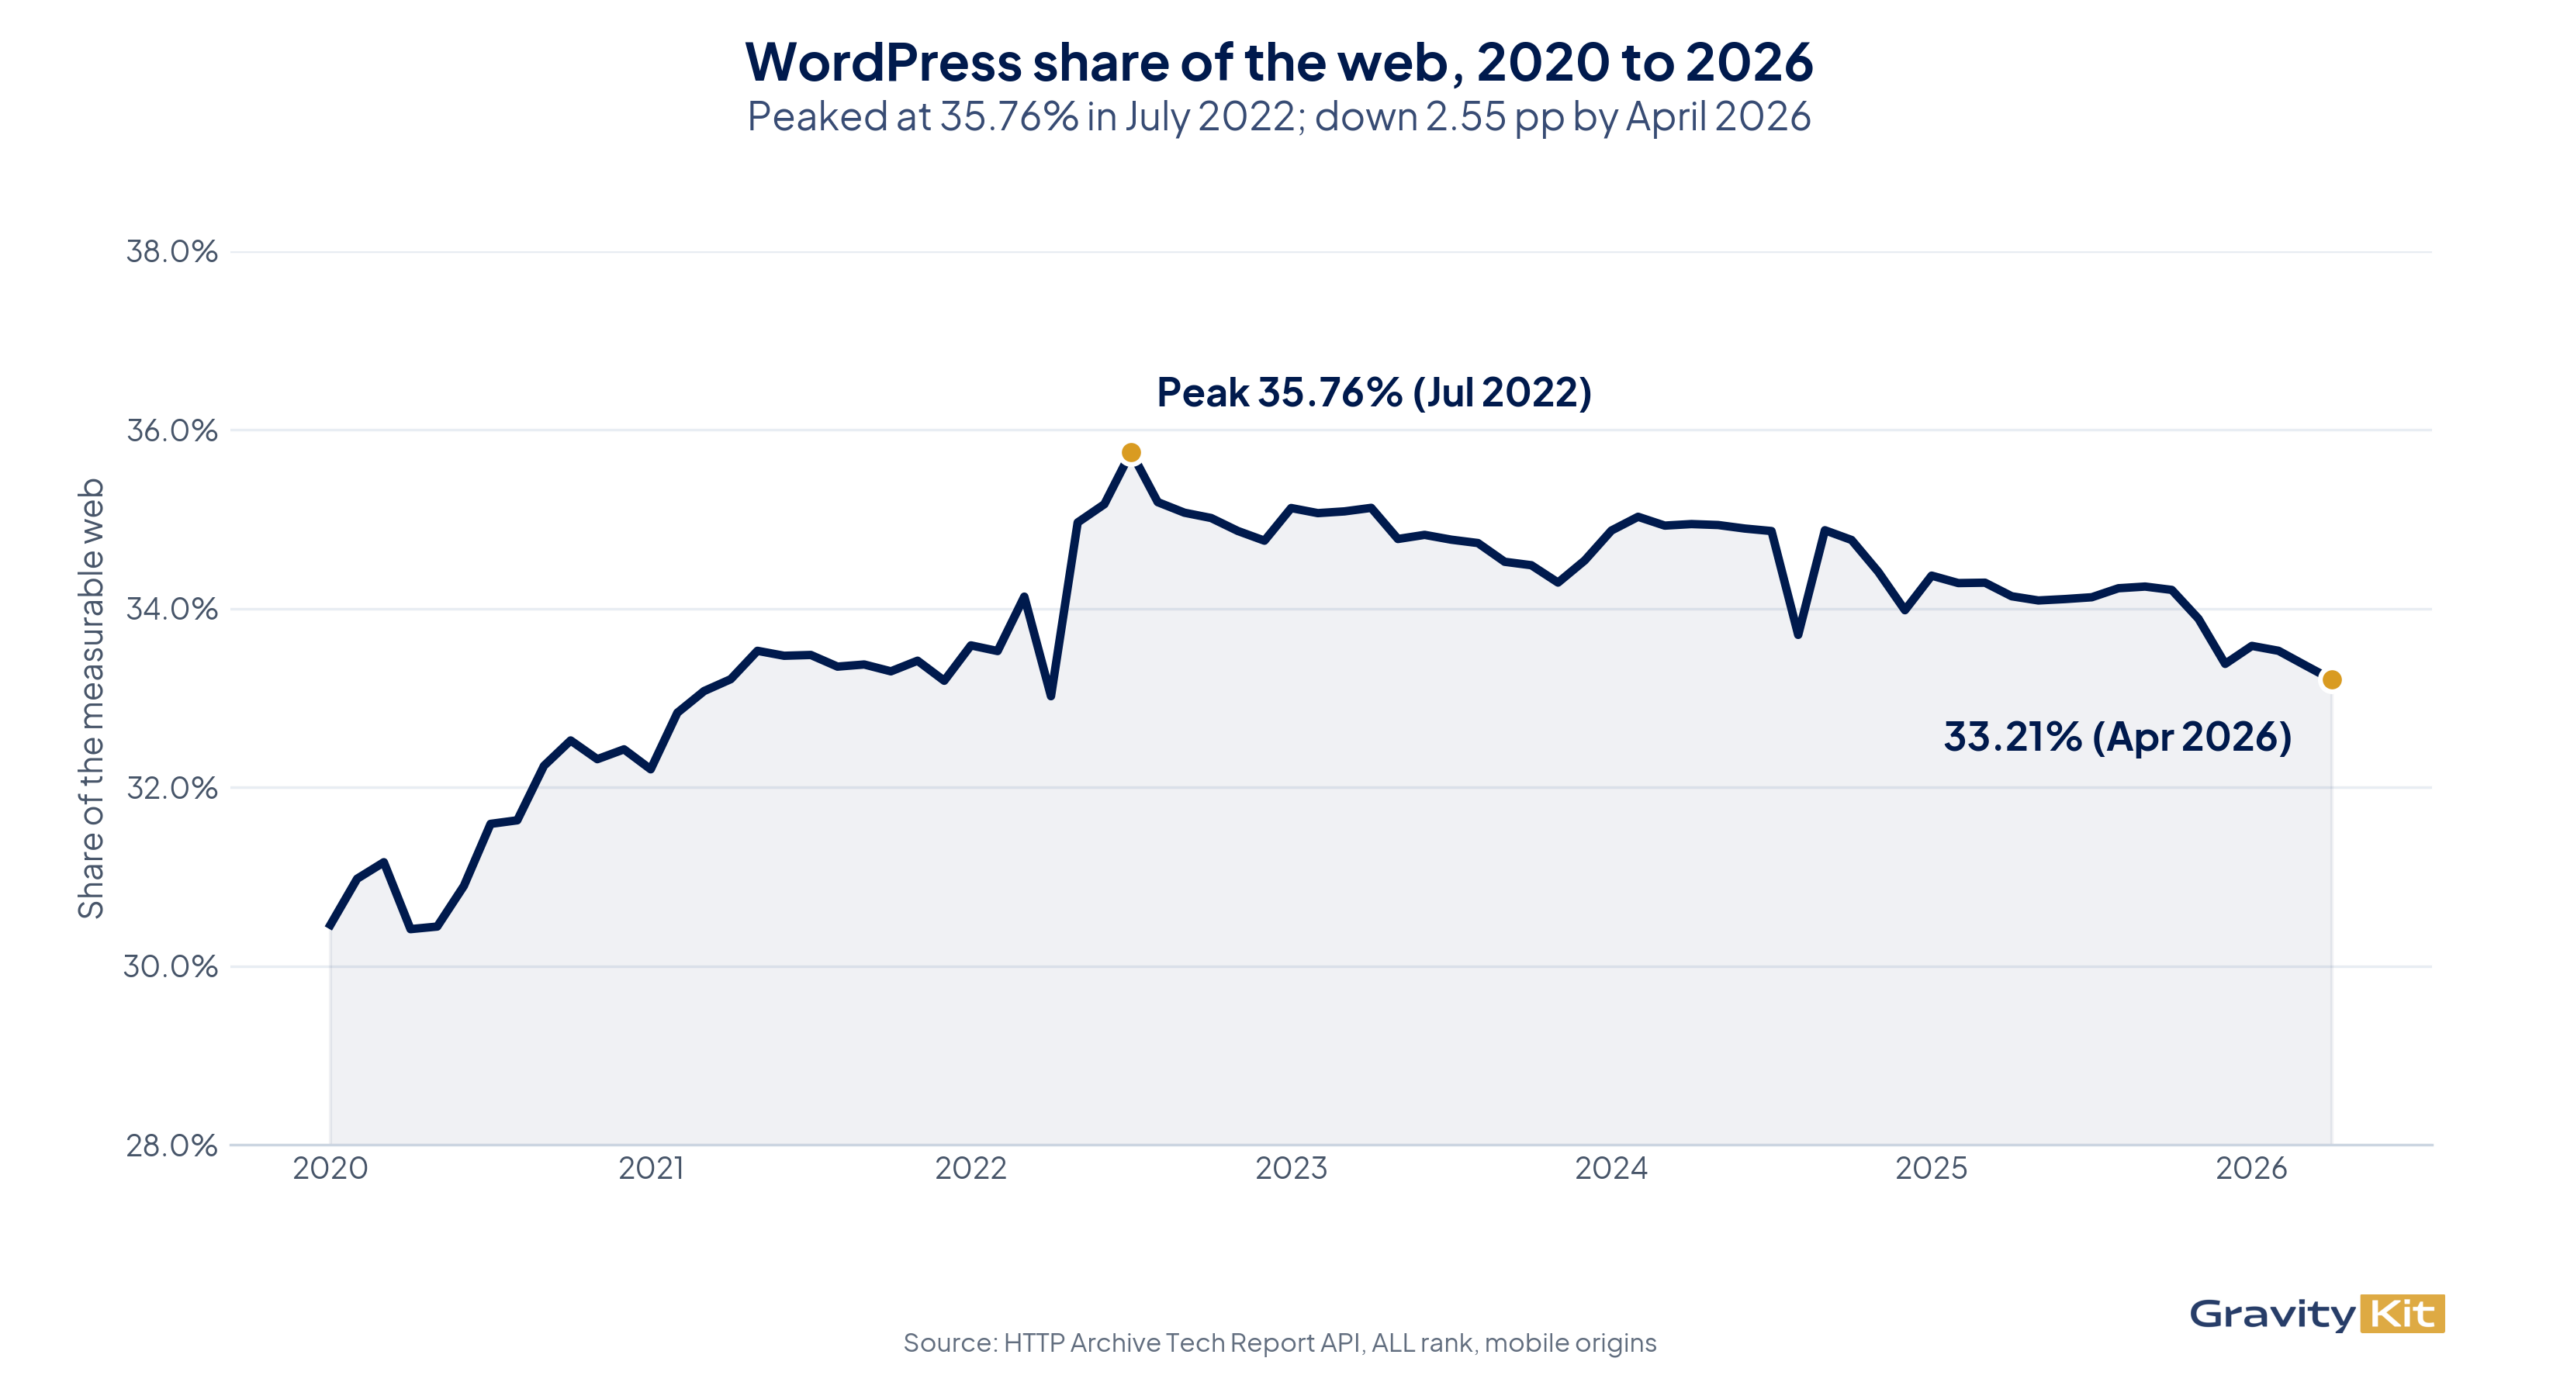
- WordPress peaked at 35.76% in July 2022 and has declined 2.55 percentage points since, roughly a 7% relative drop over four years. (Source)
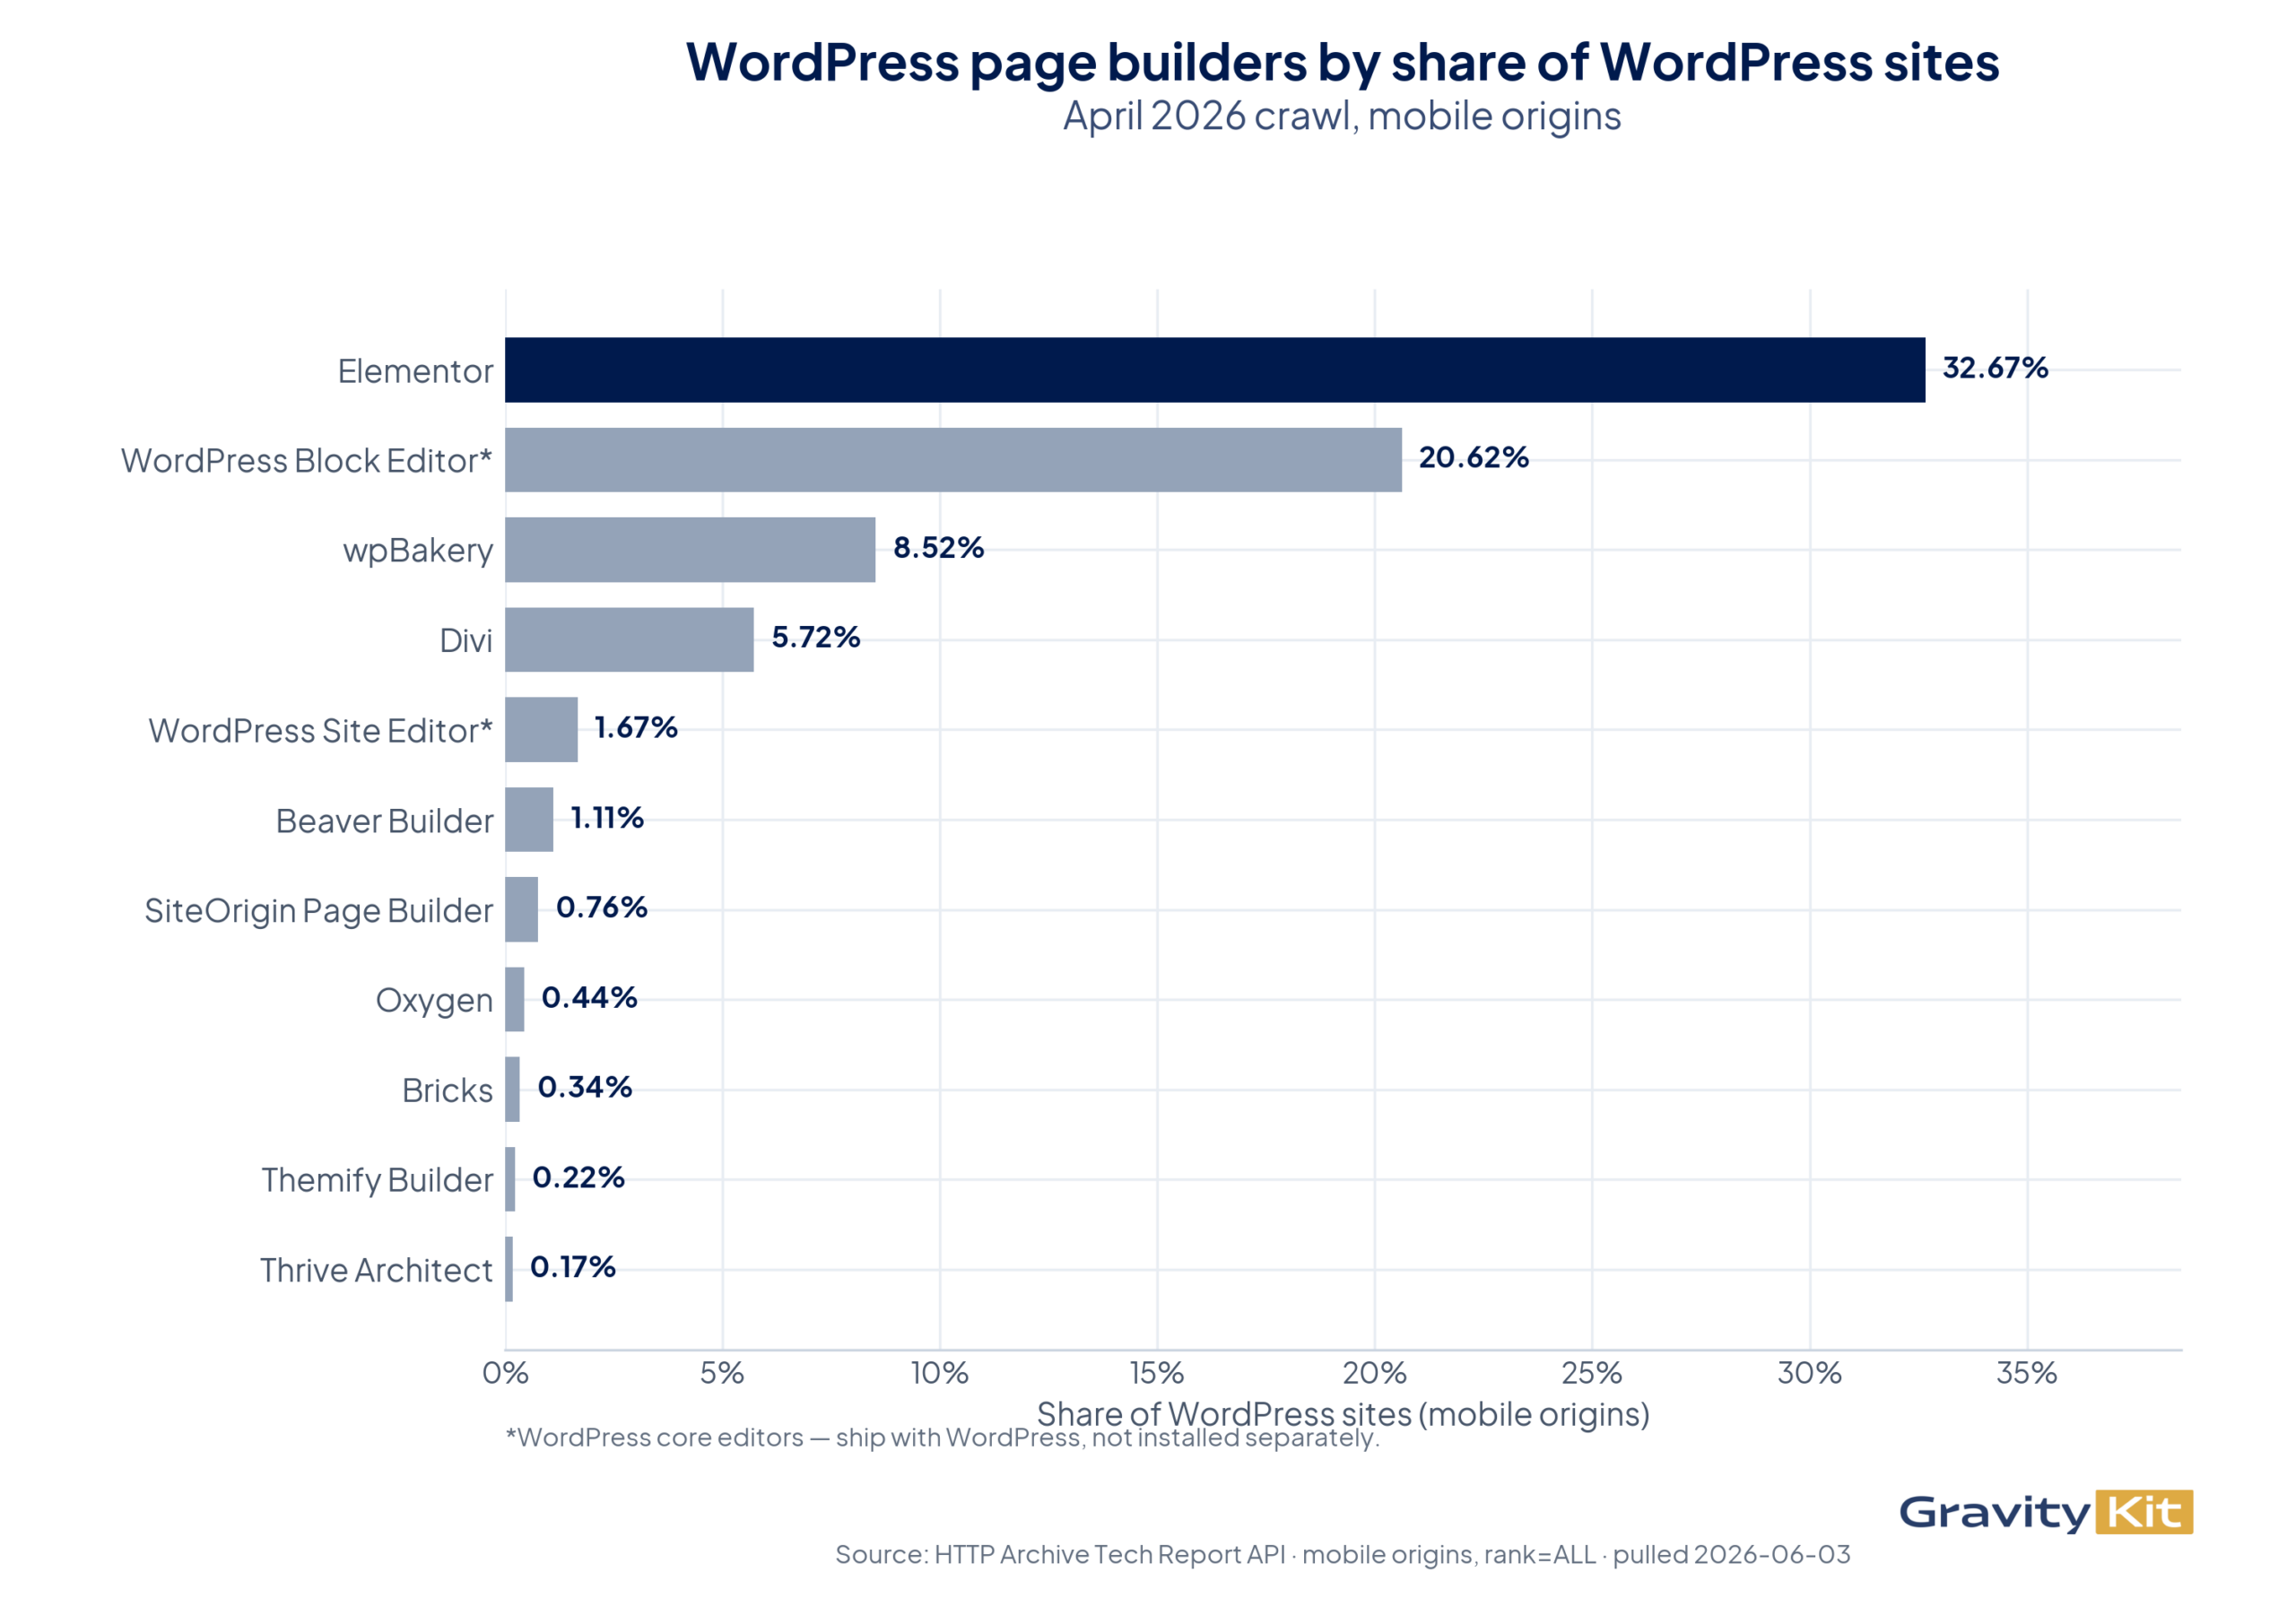
- Elementor is the most-used WordPress page builder, detected on 32.67% of WordPress sites, followed by wpBakery at 8.52%. (Source)
- Shopify is the second-biggest CMS at 4.74%, the only platform gaining share at scale (up 12.4% year over year), and it absorbed roughly 59% of the share WordPress lost this year. (Source)
- Nearly half of the measurable web (48.3%) runs no detectable CMS at all, including static sites, headless builds, and hand-coded pages, up from 46.75% in mid-2024. (Source)
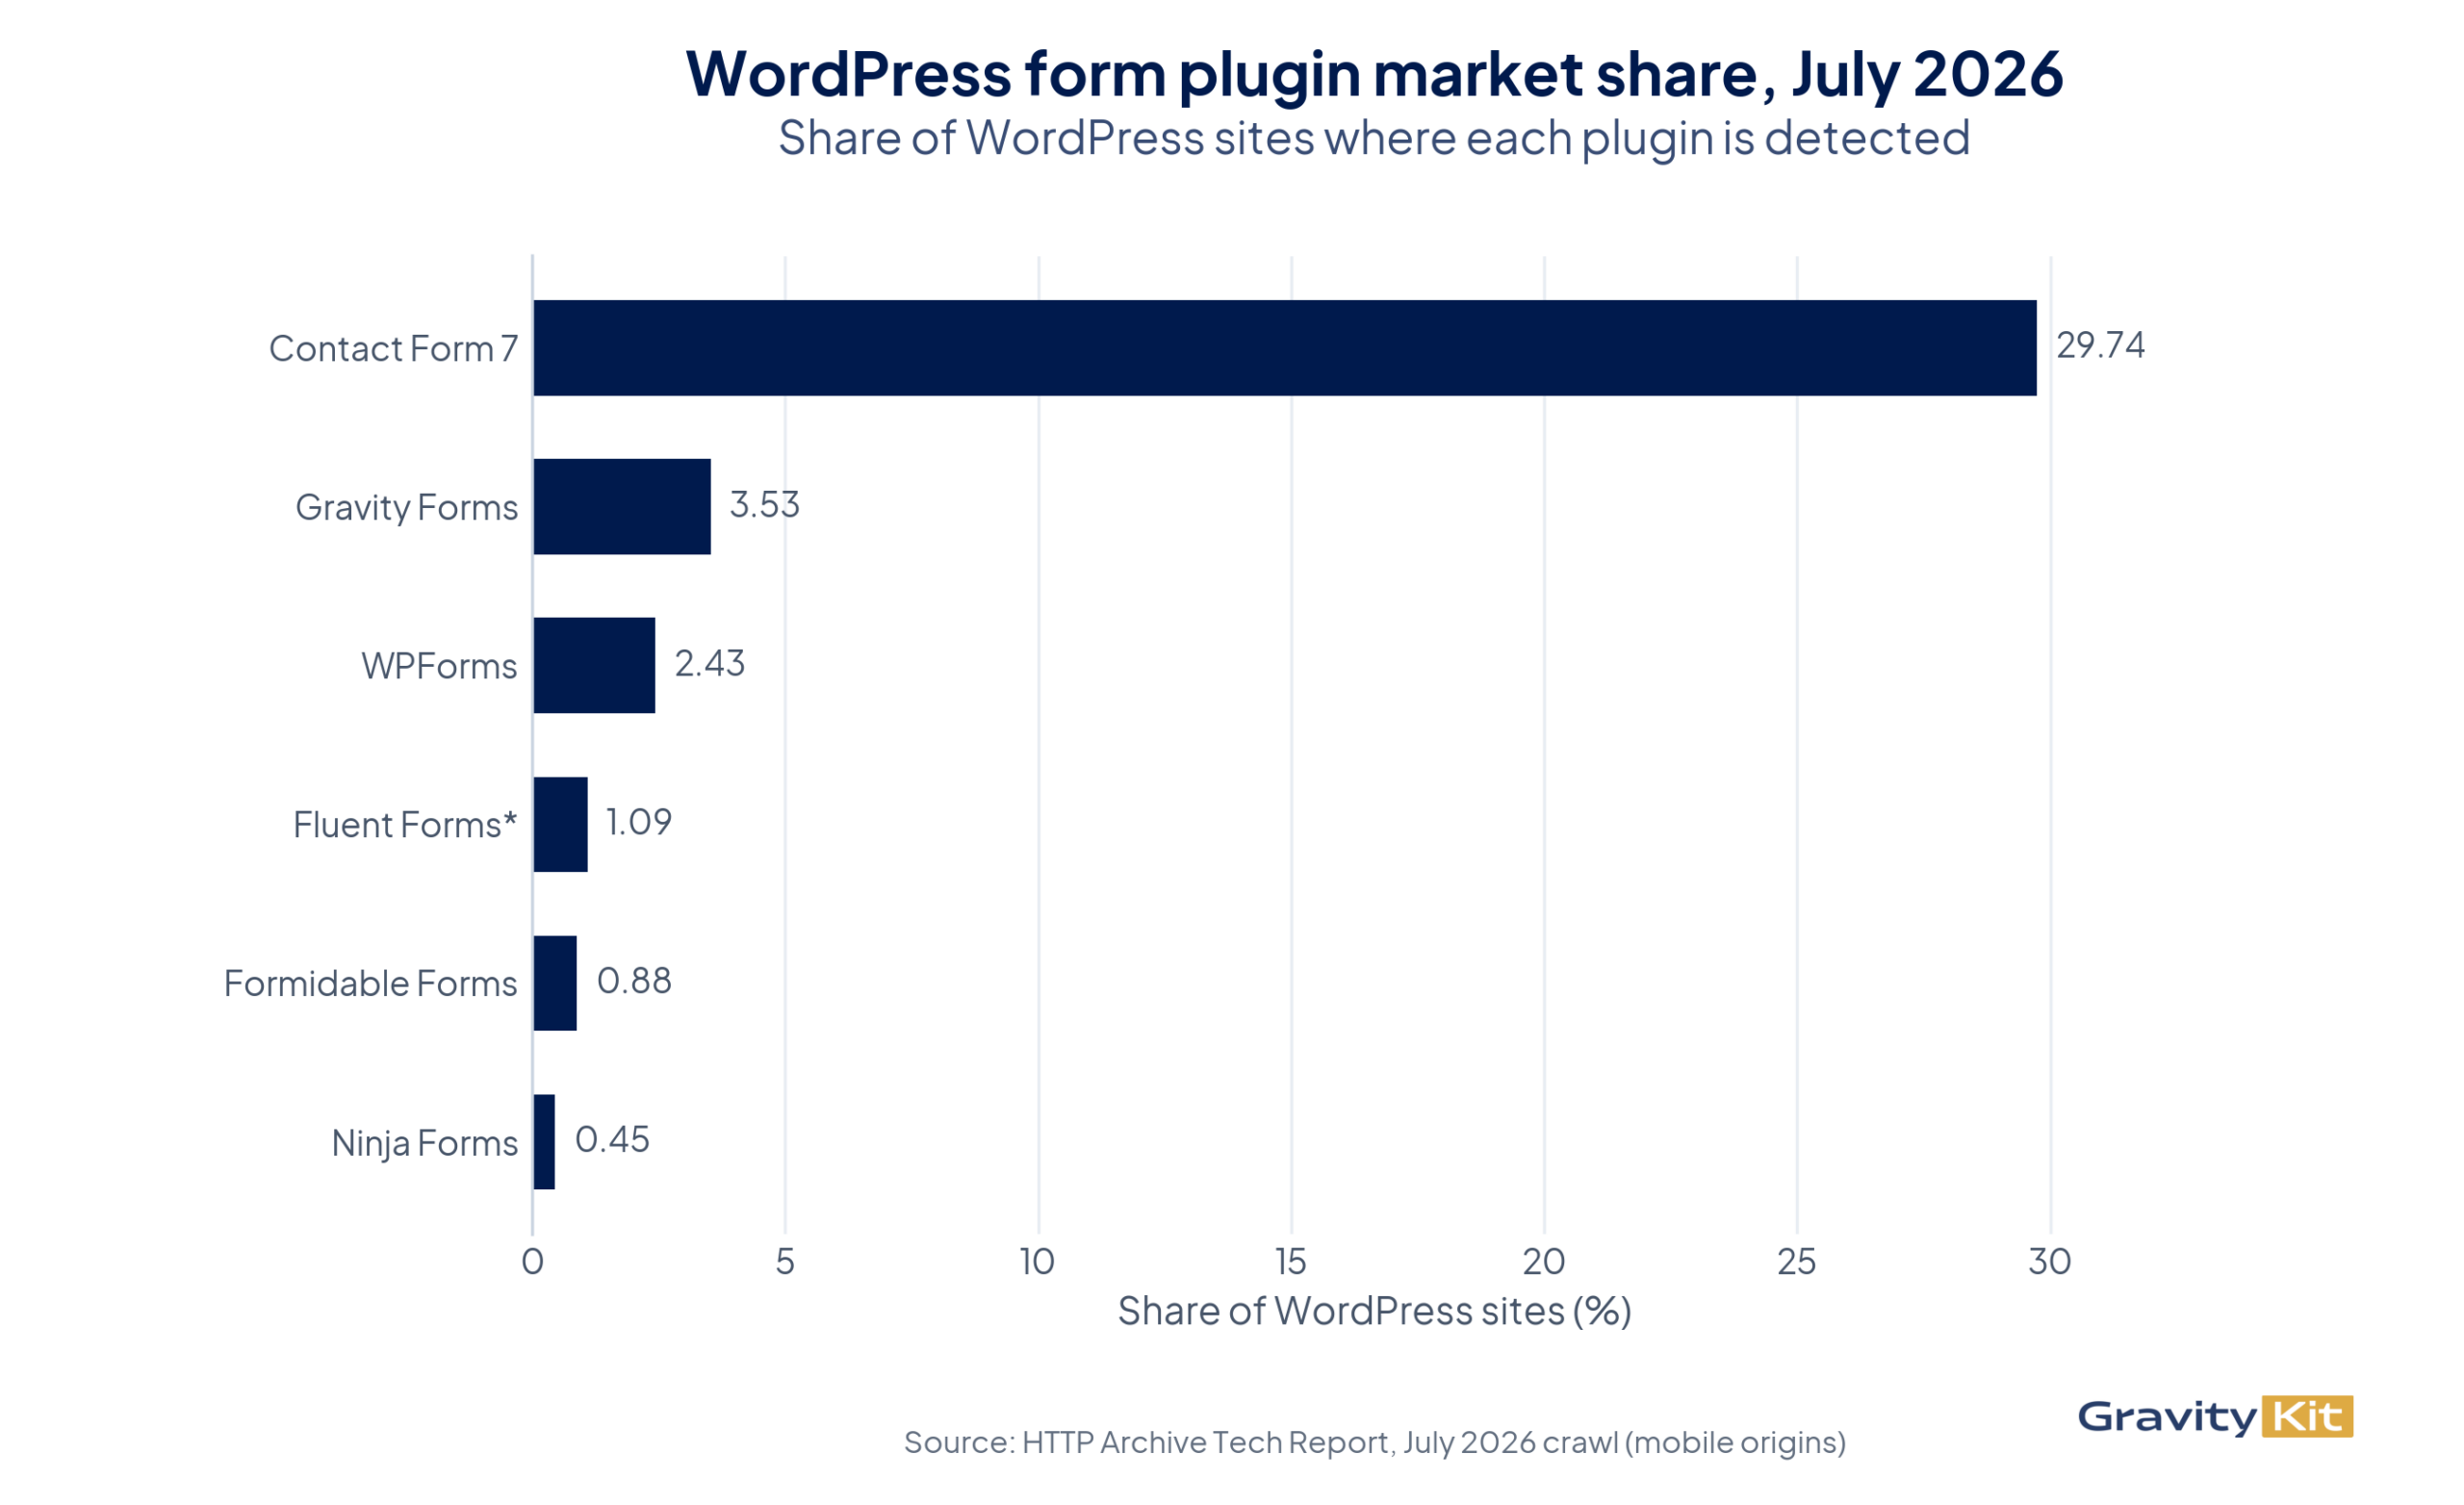
- Contact Form 7 is the most-used WordPress form plugin, detected on 29.74% of WordPress sites in July 2026, though it has lost about a quarter of its share since 2022 (down from 39.06%). Gravity Forms (3.53%) is the only tracked form plugin whose share grew over the past year. (Source)
Key questions, answered by the data
The questions people ask most about WordPress’s position on the web, answered with April 2026 HTTP Archive data.
Is WordPress losing market share?
Slowly. WordPress reached an all-time high of 35.76% in July 2022 and has eased to 33.21% as of April 2026, down 2.55 percentage points, or about 7% in relative terms, over four years. It’s still the most-used CMS by a wide margin: the next platform, Shopify, sits at just 4.74%.
How does WordPress compare to other CMSs?
It’s not close. WordPress (33.21%) is more than seven times the size of the next CMS, Shopify (4.74%), and larger than every other detected CMS combined, about 64% of all sites that use a detectable CMS. Wix (2.21%), Squarespace (1.13%), and Webflow (0.73%) trail well behind.
Which WordPress page builder leads?
Elementor, by a wide margin. It’s detected on 32.67% of WordPress sites as of April 2026, up 2.51 points year over year, while the next installed builder, wpBakery, has slipped to 8.52%. Divi holds steady at 5.72%, and Bricks is the fastest riser, up 71.2% year over year off a small base.
How does WooCommerce compare to Shopify?
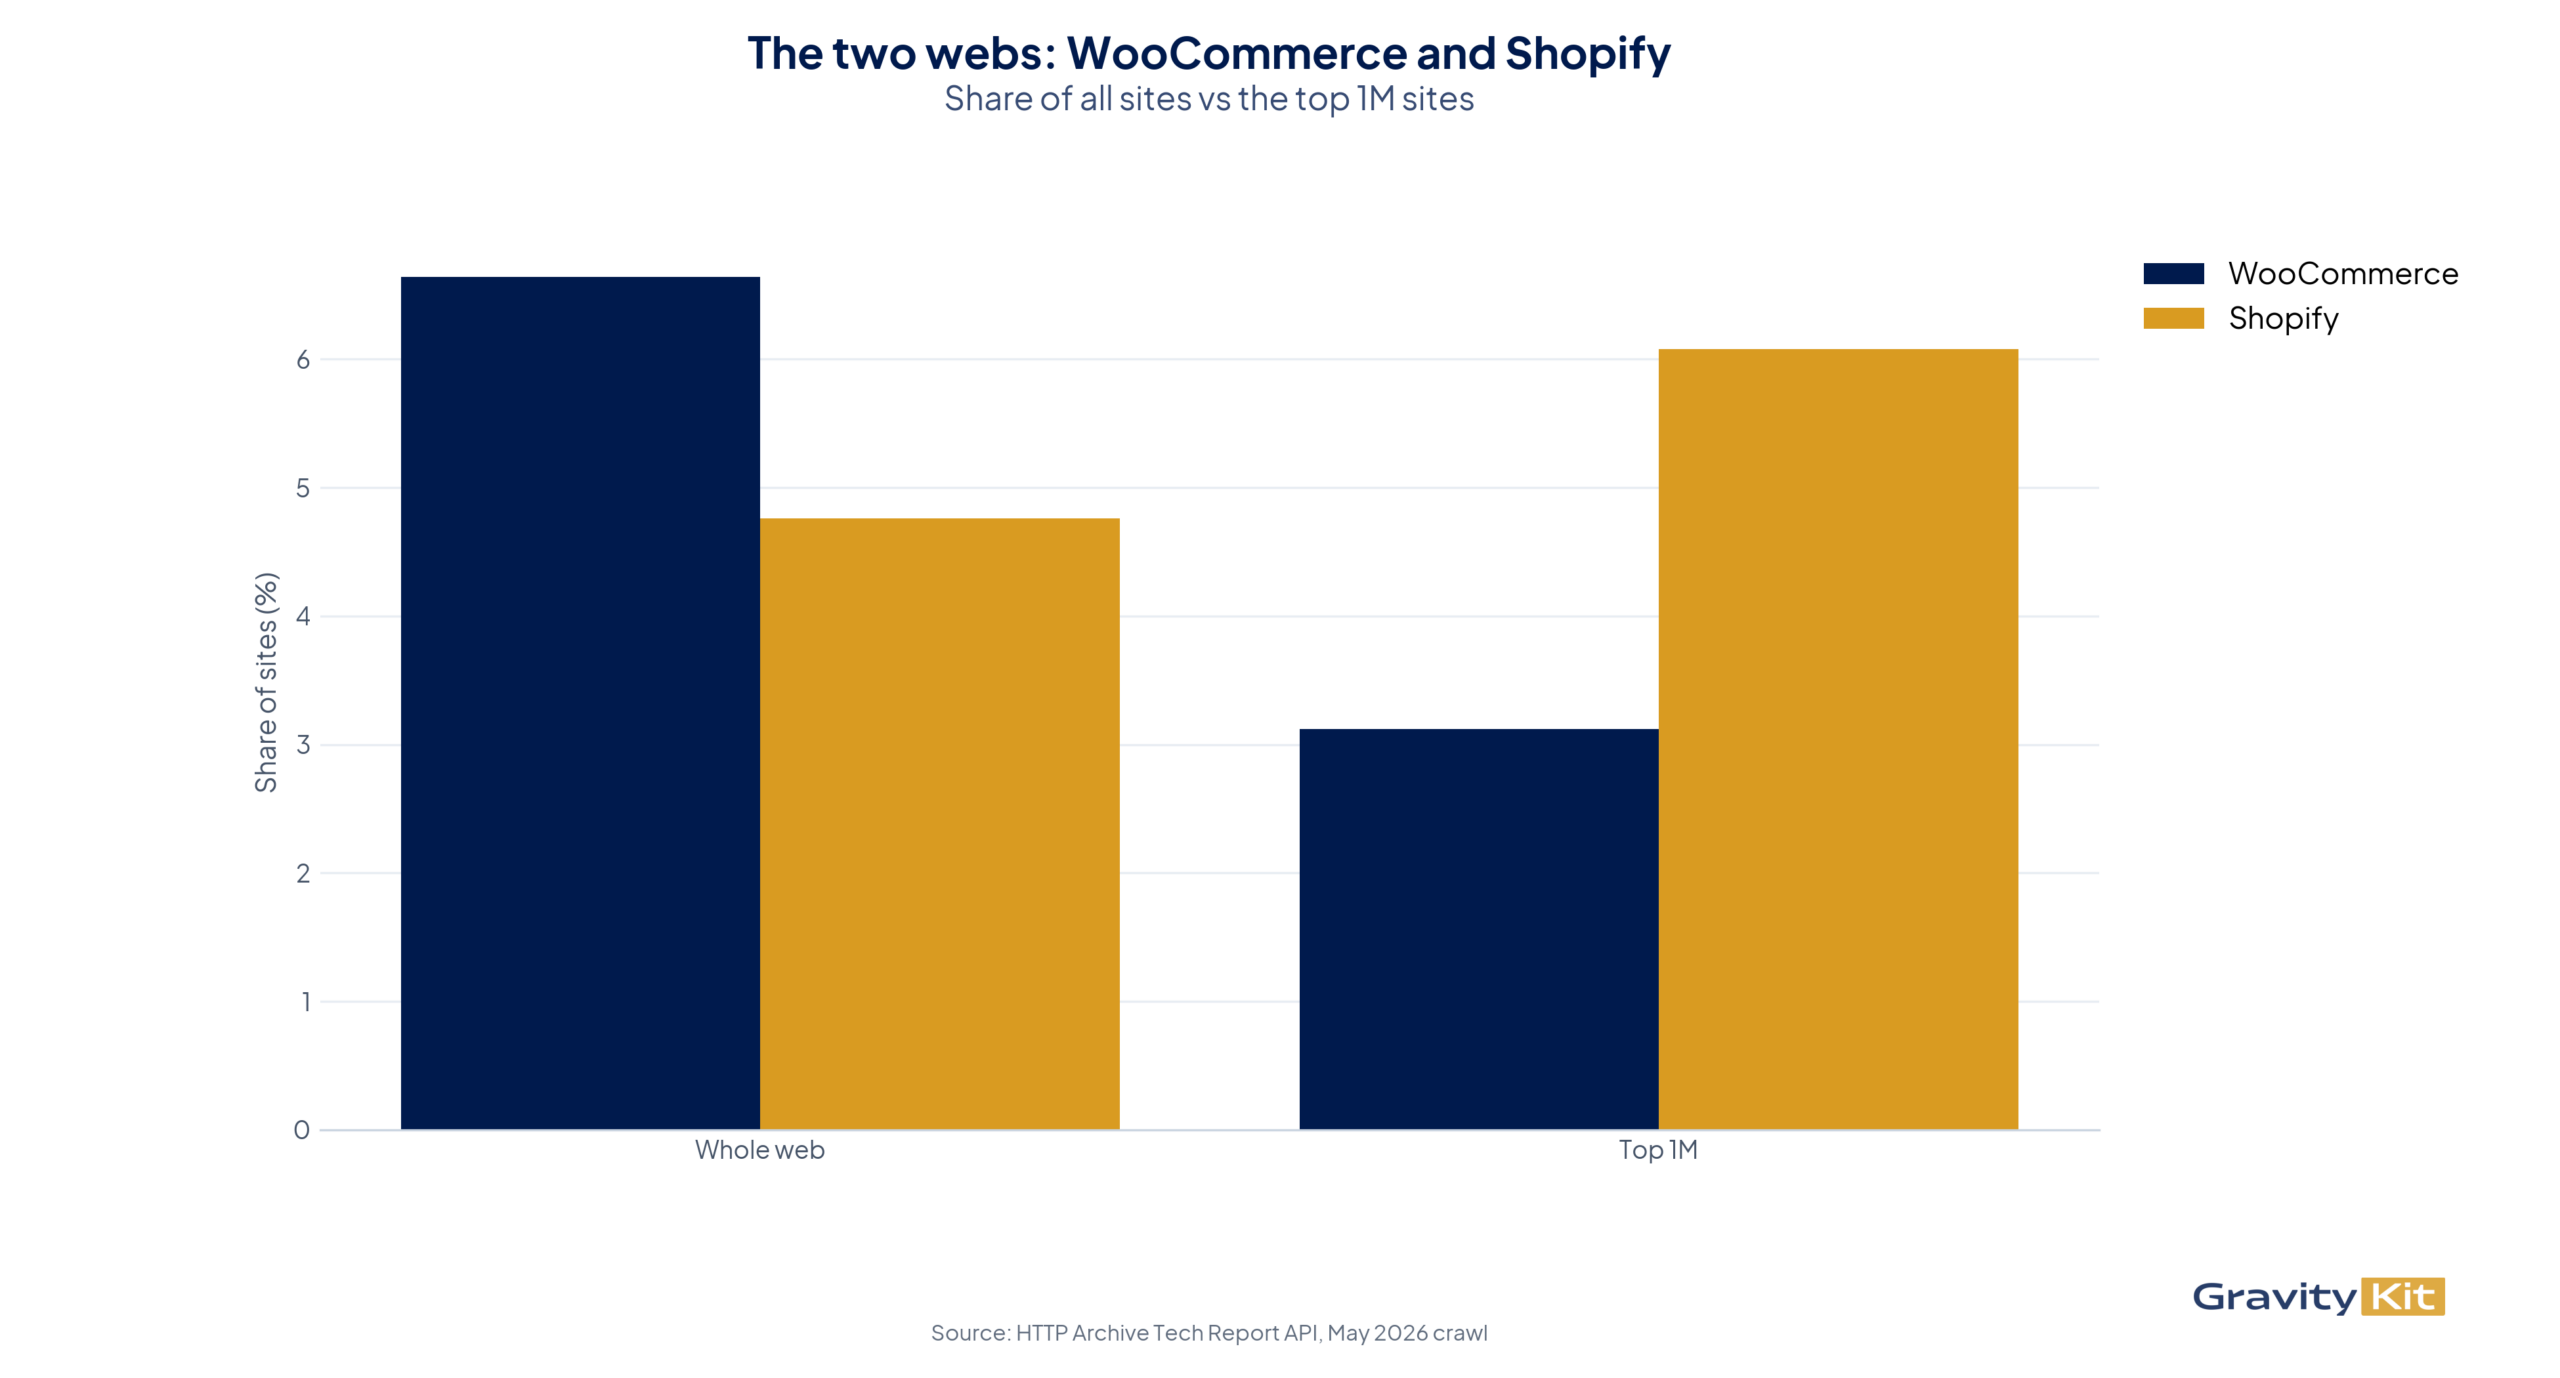
On the web as a whole, WooCommerce leads: it runs 6.64% of measurable sites to Shopify’s 4.76%. But it’s a tale of two webs. Among the most popular sites (HTTP Archive’s top-1M popularity tier), Shopify overtakes WooCommerce, 6.08% to 3.12%, and it’s the only large ecommerce platform still growing. WooCommerce wins on breadth; Shopify wins the top tier.
Which WordPress form plugin is most used?
Contact Form 7, by a wide margin. It’s detected on 29.74% of WordPress sites as of July 2026, about three and a half times the other five tracked plugins combined. Gravity Forms is second at 3.53%, followed by WPForms (2.43%), Fluent Forms (1.09%), Formidable Forms (0.88%) and Ninja Forms (0.45%). Every plugin with a year of history lost detected sites over the past year, but Gravity Forms lost the fewest and is the only one whose share of WordPress sites went up.
WordPress vs other platforms
| Platform | Share of measurable web | YoY change |
|---|---|---|
| WordPress | 33.21% | −0.93 pp |
| Shopify | 4.74% | +0.57 pp |
| Wix | 2.21% | +0.02 pp |
| Drupal | 1.14% | −0.13 pp |
| Joomla | 1.14% | −0.18 pp |
| Squarespace | 1.13% | +0.03 pp |
| Webflow | 0.73% | +0.05 pp |
WordPress page builders by market share
| Page builder | Share of WordPress sites | YoY change |
|---|---|---|
| Elementor | 32.67% | +2.51 pp |
| WordPress Block Editor* | 20.62% | +1.04 pp |
| wpBakery | 8.52% | −1.22 pp |
| Divi | 5.72% | +0.06 pp |
| WordPress Site Editor* | 1.67% | +0.52 pp |
| Beaver Builder | 1.11% | −0.05 pp |
| SiteOrigin Page Builder | 0.76% | −0.12 pp |
| Oxygen | 0.44% | +0.00 pp |
| Bricks | 0.34% | +0.15 pp |
| Themify Builder | 0.22% | −0.01 pp |
| Thrive Architect | 0.17% | −0.05 pp |
eCommerce platforms by market share
| Rank | Platform | Share of the measurable web | Share of named platforms |
|---|---|---|---|
| 1 | WooCommerce | 6.64% | 39.0% |
| 2 | Shopify | 4.76% | 27.9% |
| 3 | Wix eCommerce | 1.48% | 8.7% |
| 4 | Squarespace Commerce | 1.12% | 6.6% |
| 5 | PrestaShop | 0.60% | 3.5% |
| 6 | 1C-Bitrix | 0.57% | 3.4% |
| 7 | Magento / Adobe Commerce | 0.38% | 2.2% |
| 8 | OpenCart | 0.24% | 1.4% |
| 9 | Tiendanube | 0.20% | 1.2% |
| 10 | Nuvemshop | 0.15% | 0.9% |
| 11 | BigCommerce | 0.14% | 0.8% |
WordPress form plugins by market share
| Form plugin | Share of WordPress sites | YoY change |
|---|---|---|
| Contact Form 7 | 29.74% | −1.70 pp |
| Gravity Forms | 3.53% | +0.05 pp |
| WPForms | 2.43% | −0.26 pp |
| Fluent Forms* | 1.09% | n/a |
| Formidable Forms | 0.88% | −0.02 pp |
| Ninja Forms | 0.45% | −0.03 pp |
*Added to HTTP Archive’s detection library in July 2026; no year-over-year data yet. Source: HTTP Archive, July 2026.
Methodology
- Primary data source: the HTTP Archive public dataset, which crawls the ~8.9 million origins in the Chrome UX Report and detects technologies via a Wappalyzer-based fingerprint.
- What “market share” means here: the % of all measurable web origins (the denominator includes sites with no detected CMS). This is why our 33.21% differs from W3Techs’ ~43% figure, which uses a different denominator — both are correct for what they measure.
- Sample & scope: mobile origins, deduplicated by site. Detection has known limits (custom/obfuscated stacks under-report).
- Freshness: headline figures refreshed quarterly; each figure is dated inline. Last updated June 2026.
- Cross-reference: W3Techs and BuiltWith are linked for context where their methodology differs.

Helpful tips right in your inbox.
Subscribe to get the latest articles, information on releases and helpful Gravity Forms tips!