Published
•
Updated
Announcing GravityCharts 1.14: Powerful new grouping options and enhanced performance
GravityCharts 1.14 adds flexible aggregate grouping for non-date fields, letting you chart totals or averages by category, product, or campaign without writing code.

We’re excited to announce the release of GravityCharts 1.14. This update provides more flexibility with powerful new grouping options, enhanced performance for larger datasets, and support for min and max values.
Let’s dive in!
Powerful new grouping options (aggregates)
Aggregates allow you to group entries by a specific field value and chart numerical data for those groups. Previously, this was only supported for date values, enabling you to chart values over time (by day, week, month, quarter, or year).
Now, aggregates are no longer tied to timeline charts—meaning you can group data by other fields as well, not just dates.
This enables powerful new use cases! For example, you could chart the total sum of sales per product category, or the average donation per campaign.
Here’s an example to illustrate how this works:
- Data Type: Select “By Field” to group data by a field option, rather than a date value.
- Data Source: Choose a field with multiple options to chart on the x-axis (for example, a Drop Down or Radio Buttons field).
- Data Operation: Select the operation to perform. If you select min, max, average, or sum, you’ll need to choose a numerical field to chart on the y-axis.
- Data Field: Choose a numerical field to chart on the y-axis.
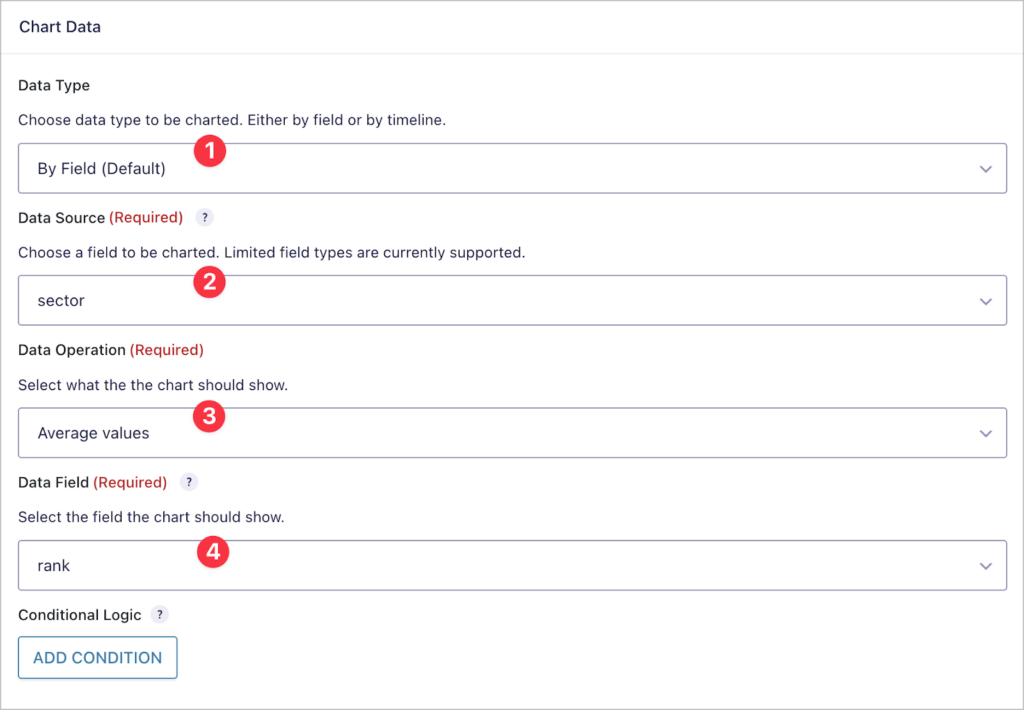
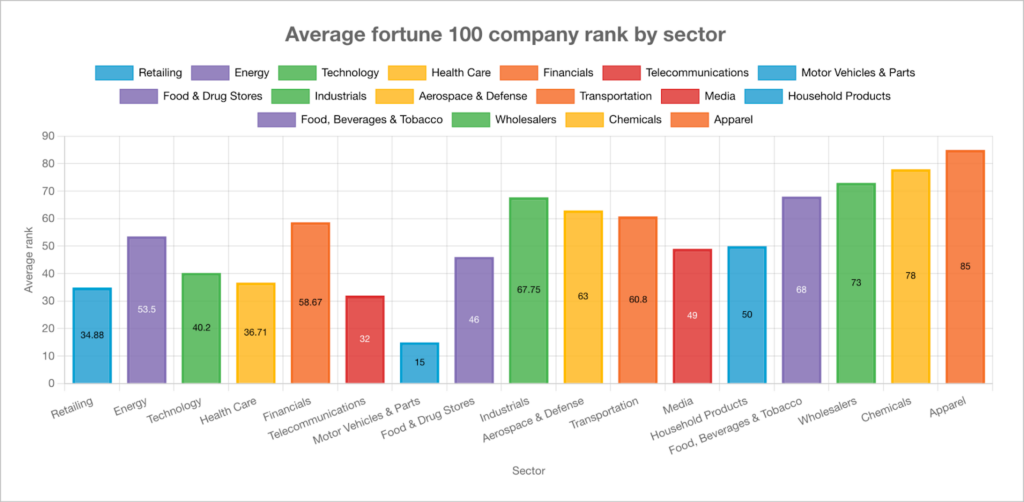
So in this example, we’re charting the average Fortune 100 company rank (y-axis) by sector (x-axis).
Support for min and max values
You can now chart the minimum and maximum values for a dataset—perfect for tracking highs and lows alongside existing totals, averages, and counts. Here’s a full list of supported operations:
- Entry count
- Sum values
- Maximum value
- Minimum value
- Average values
Performance enhancements
We’ve completely reworked how aggregate values are calculated—and the results speak for themselves.
Rather than processing entries one by one, GravityCharts now queries data directly from the database, delivering results faster and more efficiently, especially on large forms.
Translation? Your charts load quicker and your insights come faster!
All new developer hooks
We also added several new developer hooks, enabling you to customize field labels, values, the number of decimals places, and more. If you’re a developer, you can take a look at the changelog for more detailed information.
Update GravityCharts today
GravityCharts 1.14 introduces powerful new features such as field grouping, support for minimum and maximum values, blazing fast performance, and new developer hooks for customizing charts even further.
Update GravityCharts today from the “Manage Your Kit” page in WordPress to start building faster, smarter, and more insightful charts.

Helpful tips right in your inbox.
Subscribe to get the latest articles, information on releases and helpful Gravity Forms tips!
More articles

10 things you can ask AI to do with Gravity Forms (using the free GravityKit MCP)
See 10 practical things you can ask AI to do with Gravity Forms using the free GravityKit MCP: create forms, manage entries, build Views, and more.

Launch Log: theme template editing in Block MCP, Shield silentCAPTCHA for Zero Spam, and GravityView fixes
Block MCP adds safe theme template editing, Gravity Forms Zero Spam gains Shield silentCAPTCHA support, and GravityView fixes lightbox and notice bugs.

GravityKit turns 12: a year in review, and 30% off Lifetime All Access
GravityKit turns 12. A look back at a year of GravityView 3.0, GravitySearch, and AI-assisted building, plus a birthday sale on the Lifetime All Access Pass.