Published
•
Updated
Introducing GravityCharts: Create Beautiful Charts and Graphs Using Your Gravity Forms Data
We’re pleased to announce the release of GravityCharts, the ultimate charting solution for Gravity Forms! 📊 GravityCharts allows you to create beautiful, custom charts and graphs using your Gravity Forms data. Select from 5 different chart types, style your charts with our extensive customization...
We’re pleased to announce the release of GravityCharts, the ultimate charting solution for Gravity Forms! 📊
GravityCharts allows you to create beautiful, custom charts and graphs using your Gravity Forms data. Select from 5 different chart types, style your charts with our extensive customization options, and build powerful dashboards – All of this using a modern, intuitive and accessible user interface.
Keep reading to find out more about GravityCharts, the latest addition to our suite of essential Gravity Forms add-ons.
See GravityCharts in Action!
In the below video, we show you how to create new chart feeds, add styles to your charts and embed your charts on a pages or posts.
What Does GravityCharts Do?
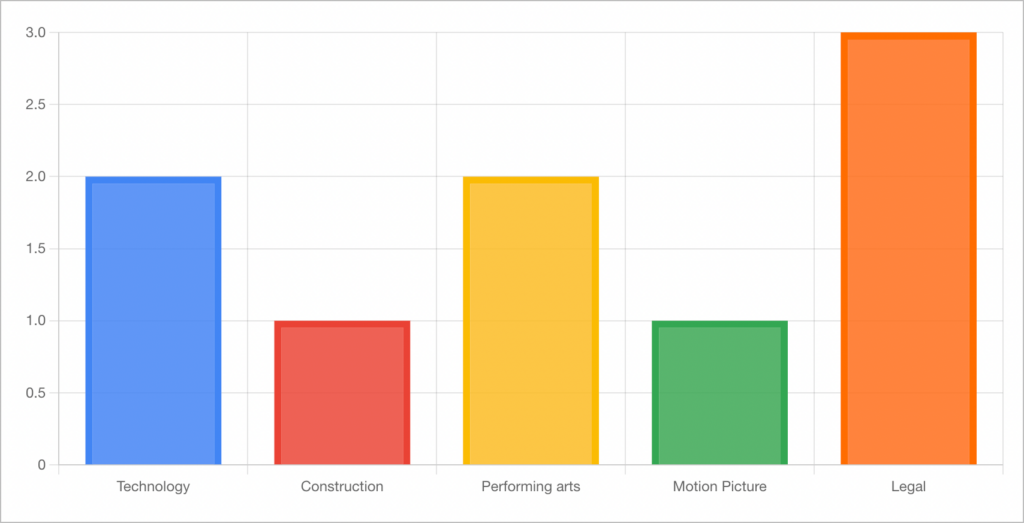
GravityCharts allows you to create graphs and charts using data you collect through your Gravity Forms. Supported fields include Drop Downs, Radio Buttons, Checkboxes and the Gravity Forms Survey field. With GravityCharts, you can create stats pages, dashboards, analytics reports and more!
Who Is GravityCharts for?
GravityCharts is for anyone looking for a way to visualize their Gravity Forms data. Charts you create using GravityCharts are modern, beautiful and fully customizable. GravityCharts gives you an easy way to create and automate reports in Gravity Forms.
Creating New Charts
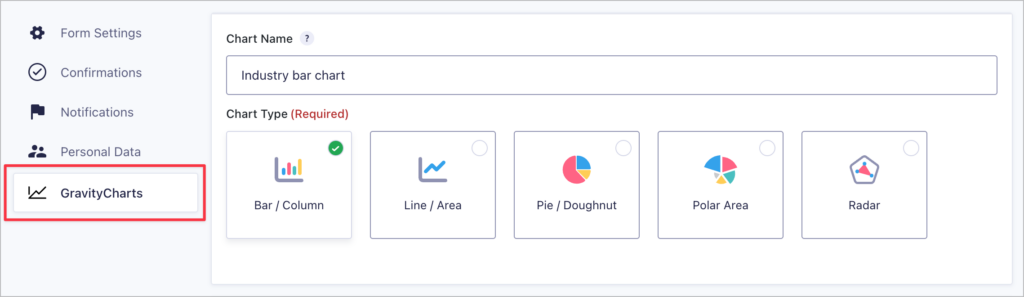
After installing GravityCharts, head over to the Form Settings page and click on the GravityCharts tab on the left. Next, choose one of the 5 available chart types and select a data source for your chart.
When you scroll down, you’ll see a live-updating chart preview with a range of options for customizing the design of your chart.
Customizing the Design
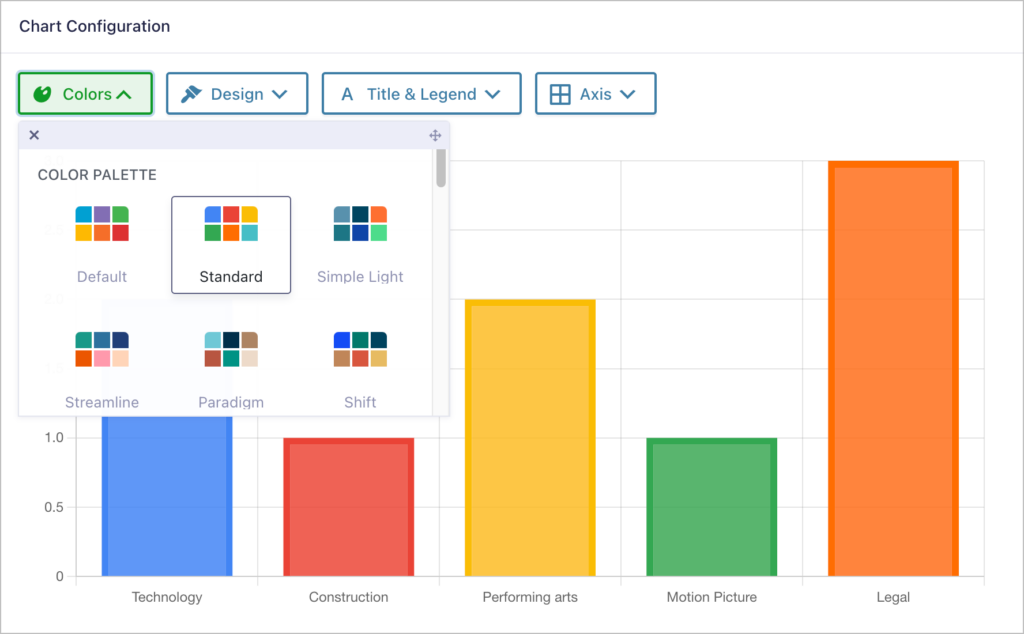
The chart configuration window includes four style tabs:
- Colors – Choose from one of our predefined color palettes.
- Design – Change the line thickness, chart layout and more.
- Titles & Legend – Display and position the chart title and legend.
- Axis – Adjust the scale and grid lines.
As you tweak aspects of the design, the chart preview will update in-real time to reflect your changes. This allows you to create the perfect chart before adding it to a live page on your site.
When you’re done, open your page editor to embed your new chart on the front end.
Embedding Charts in Your Pages and Posts
Embedding your charts in pages or posts is easy using the GravityCharts Gutenberg block.
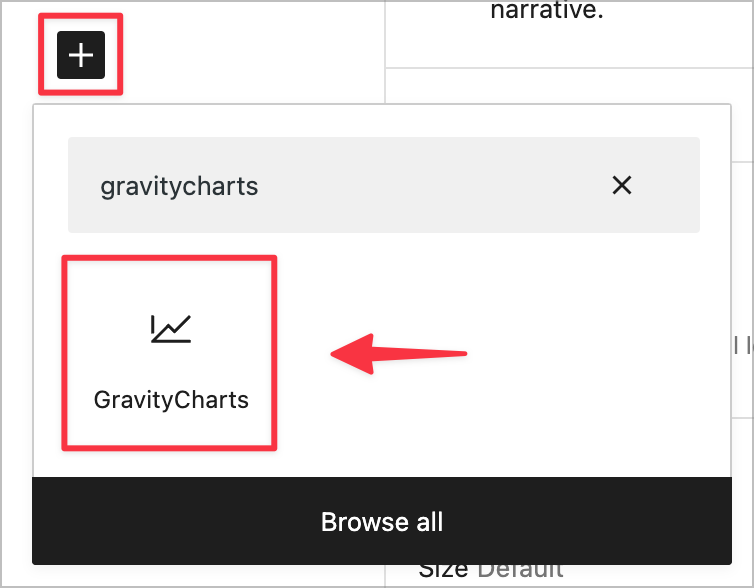
After adding the block to your layout, simply select a form and a GravityCharts feed. After that, you’ll see a preview of your chart inside the editor.
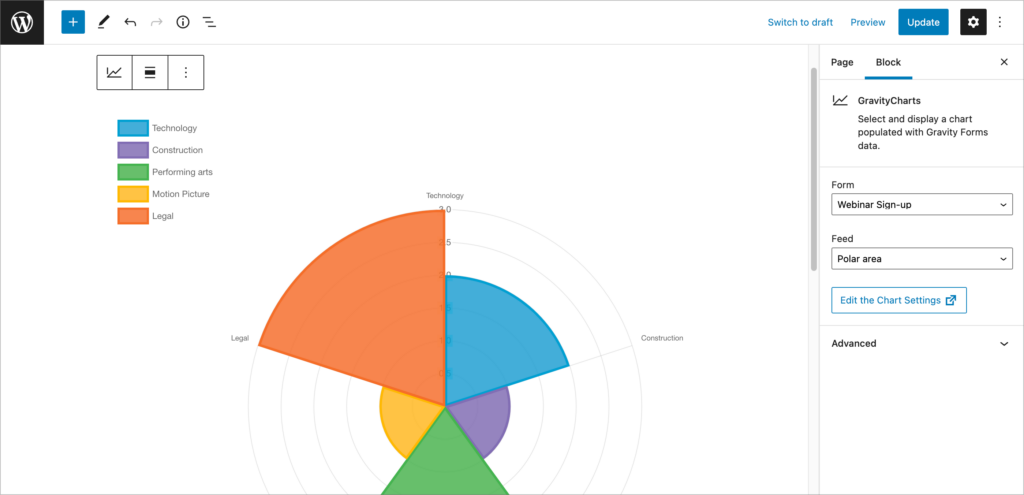
After saving your page, your new chart will automatically update as you receive new entries.
Adding Charts to Your Views in GravityView
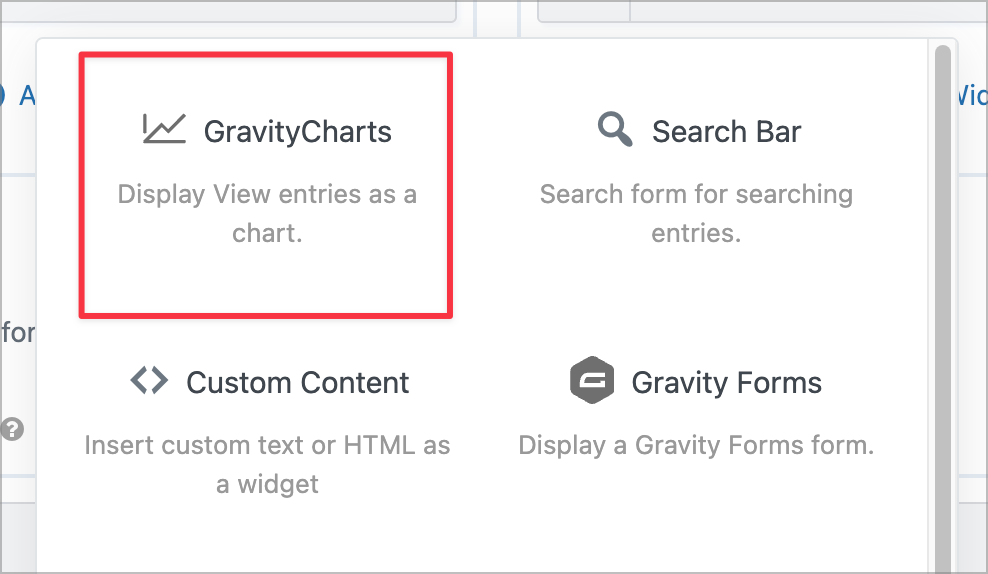
GravityCharts is deeply integrated with GravityView, allowing you to integrate charts into your front end applications using the “GravityCharts” widget. You can configure the widget to display data from all entries, all entries in your View, or only entries that are visible on the page!
Get GravityCharts Today!
GravityCharts is the ultimate charting and graphing solution for Gravity Forms. With GravityCharts, you can create beautiful visualizations using your form data, build powerful dashboards and uncover valuable insights.
GravityCharts is now available to purchase as either a standalone plugin or as part of our All Access license. If you have any questions about GravityCharts, check out our FAQ section or reach out to our support team!
📝 If you have a GravityView All Access license, you can install GravityCharts from the Manage Add-Ons screen in your WordPress dashboard.

Helpful tips right in your inbox.
Subscribe to get the latest articles, information on releases and helpful Gravity Forms tips!
More articles
How to build a WordPress CRM without code (a contact database you own)
Build a simple WordPress CRM with GravityView. Turn the Gravity Forms entries you already collect into a no-code contact database you own, with no monthly fees.

Launch Log: Distance sorting for radius searches, DataTables search improvements, and import reliability fixes
The latest GravityKit releases add distance sorting to map searches, bring built-in search to DataTables, and fix GravityCharts and GravityImport edge cases.
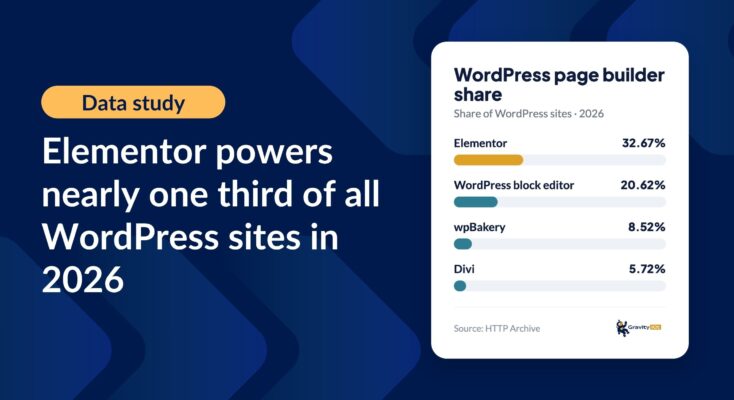
WordPress page builder market share 2026: Elementor leads at 32.67%
Elementor reaches 32.7% of WordPress sites. WordPress Block Editor 20.6%, wpBakery 8.5%, Divi 5.7%. Latest HTTP Archive crawl, share-of-WordPress basis throughout.