Published
•
Updated
How to build an expense tracker on WordPress without code
Build a complete expense tracker on WordPress without any code. Track business costs or personal budgets using Gravity Forms and GravityKit, with charts and category summaries included.
In this article, I’ll show you how to create a fully functional expense tracker on WordPress without writing a single line of code.
Whether you’re a freelancer looking to manage your business costs or just want a personal budgeting tool, this guide will walk you through setting up an expense tracker using Gravity Forms and GravityKit—no coding required!
Let’s get started.
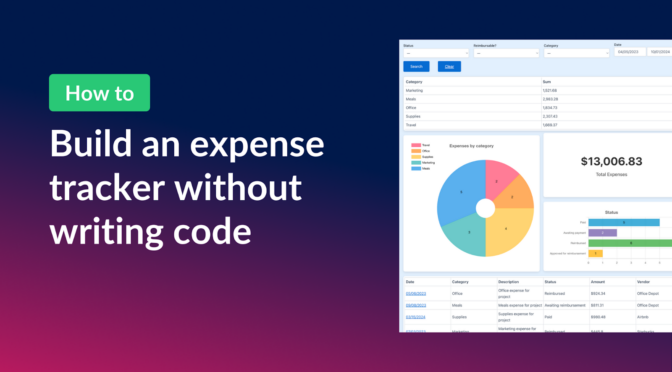
Sneak peek
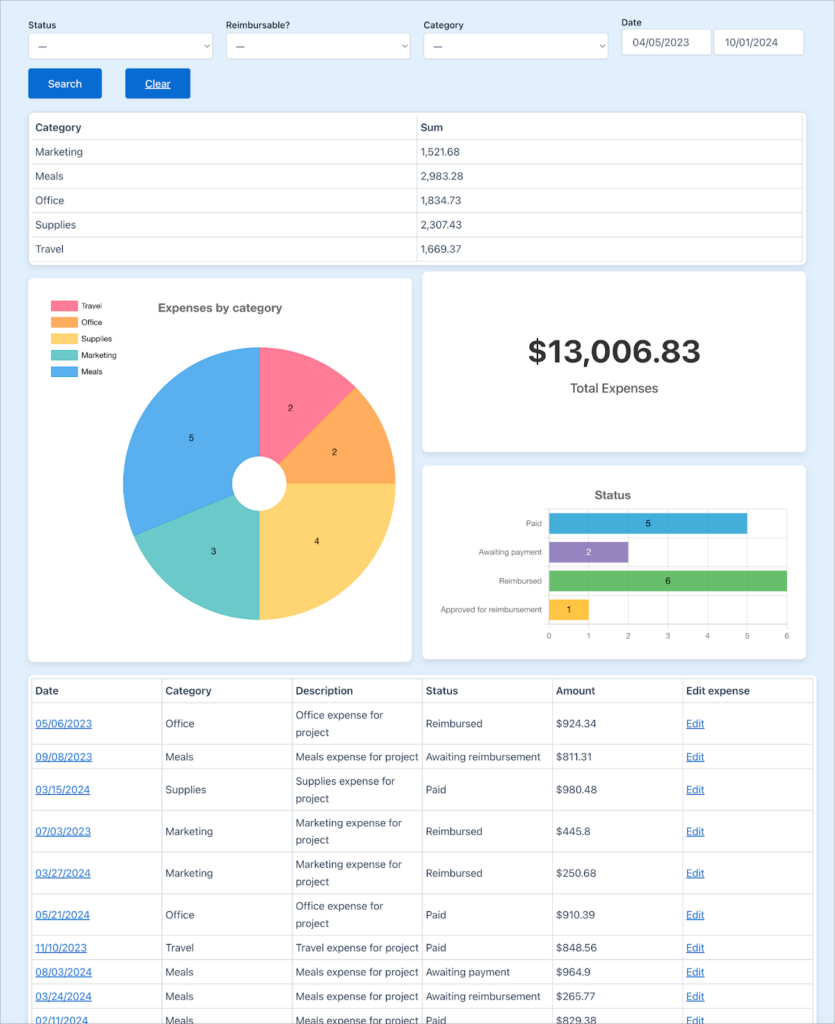
Here’s a sneak peek at the finished expense tracker. As you can see, it’s got everything you need to track and measure your business expenses.
At the top is a search bar to filter expenses by date and various other metrics. Below is a summary of expenses by category, and below that are a few charts, enabling you to visualize expenses by category and status.

Finally, there’s a table showing all expenses, which can be sorted by column values. Each expense can also be edited directly from the front-end. This enables admins (or the finance department) to update the status of an expense, without needing to access the website’s backend!
Wanna try it?
Spin up a demo
See a live no-code expense tracker built with GravityView — explore the demo.
What you’ll need
Here are the plugins that you’ll need to build an expense tracker like the one in this example:
- Gravity Forms (Basic license)
- GravityView
- GravityCharts
- GravityMath (optional)
Get everything you need with a Gravity Forms Basic license and a GravityKit All Access Pass!
What is an expense tracker?
An expense tracker is a tool that helps individuals or businesses record, monitor, and manage their spending. It serves as a centralized place to log every financial outflow, from daily personal expenses like coffee or groceries to larger business transactions such as travel or office supplies.
By keeping a detailed record of where money is going, expense trackers allow users to gain greater control over their finances, helping them identify patterns, avoid overspending, and make informed budgeting decisions.
For businesses, an expense tracker is especially crucial for keeping operations running smoothly and ensuring that costs are allocated appropriately across various projects or departments.
It provides a transparent system for tracking reimbursable expenses, processing invoices, and managing recurring payments.
Creating the expense form
The first step is to create a form that enables us to submit new expenses. To create a new form, we’ll hover over “Forms” and click “New Form”. Instead of starting with a pre-built template, we’ll start from a blank canvas and add the following fields:
- Date (“Date” field)
- Category (“Drop Down” field with options “Paid”, “Awaiting payment”, “Reimbursed”, and “Awaiting reimbursement”)
- Description (“Single Line Text” field)
- Amount (“Number” field)
- Vendor (“Single Line Text” field)
- Reimbursable? (“Drop Down” field with options “Yes and “No”)
- Status (“Drop Down” field)
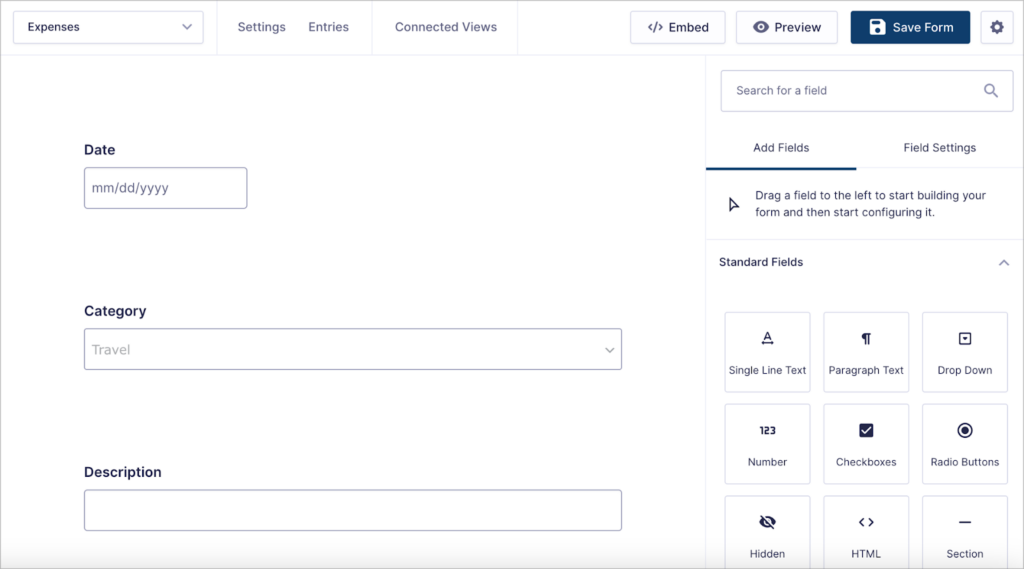
Feel free to customize the form as you see fit! Gravity Forms supports a range of field types, including File Uploads (useful if you need to attach receipts or invoices, for example).
After configuring our form, we can start building the expense tracker dashboard. Let’s start by creating the charts.
Creating charts to visualize expense data
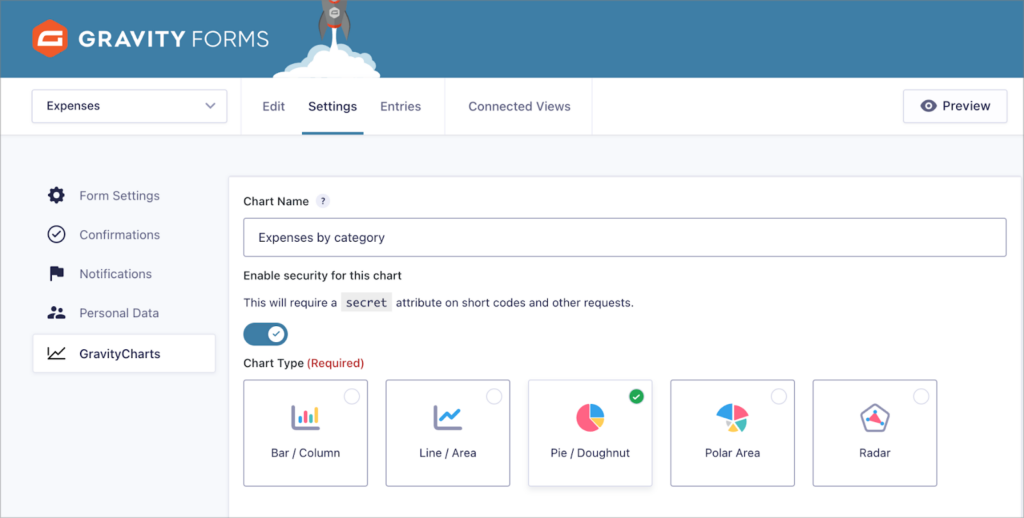
To create charts to visualize expense data, we’re going to use GravityCharts. After installing the plugin, we can create a new chart by going to the form settings screen, clicking on “GravityCharts” and then selecting “Add New”.
Let’s start by creating a pie chart to visualize expenses by category. After giving the chart a name, we’ll select the “Pie / Doughnut” chart type.
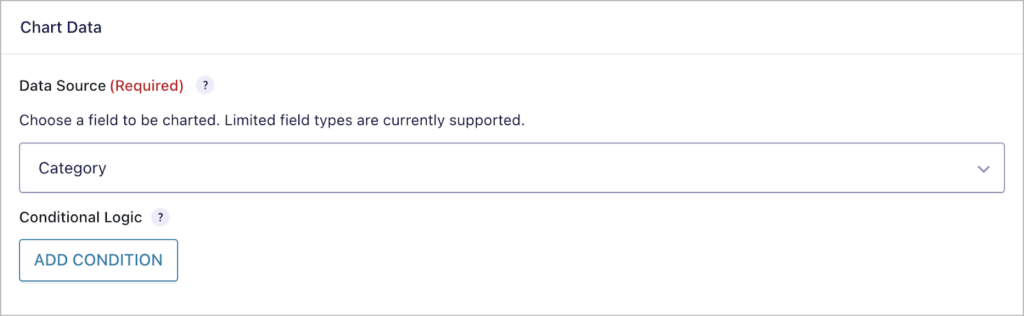
After that, we’ll need to select which form field we want to visualize (in this case “Category”).
Finally, we can customize the look and feel of our chart by configuring the various design options.
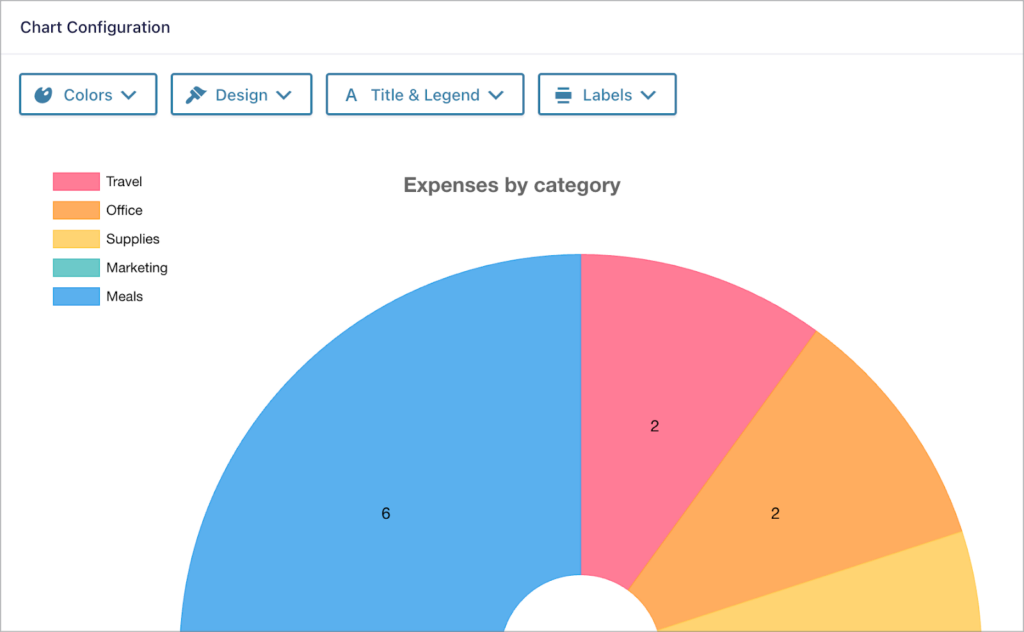
That’s it! For this example, we’re going to create one more chart to visualize expenses by status, but feel free to create as many as you need. After creating our charts, we’ll turn our attention to the rest of the dashboard. No need to embed these charts anywhere just yet.
Creating the expense tracker dashboard
Now that we have our charts set up, we can build the main expense tracker dashboard and start to put everything together.
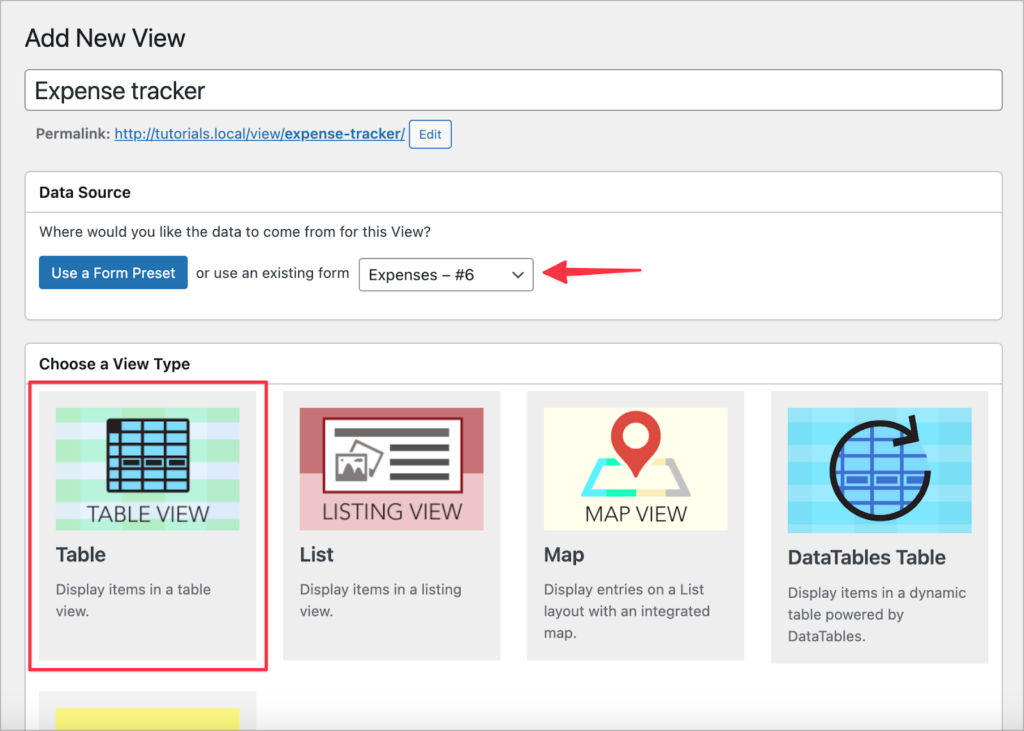
We’re going to create the dashboard using GravityView. To do this, we’ll hover over “GravityKit” and click “New View”. After giving our View a name, we’ll need to select a data source and a View type.
For the data source, we’ll select our “Expenses” form that we created in the first step and for the View type, we’ll choose “Table”.
Now we can start configuring our View using the GravityView drag-and-drop builder. Let’s start by adding the fields we want to display in our table.
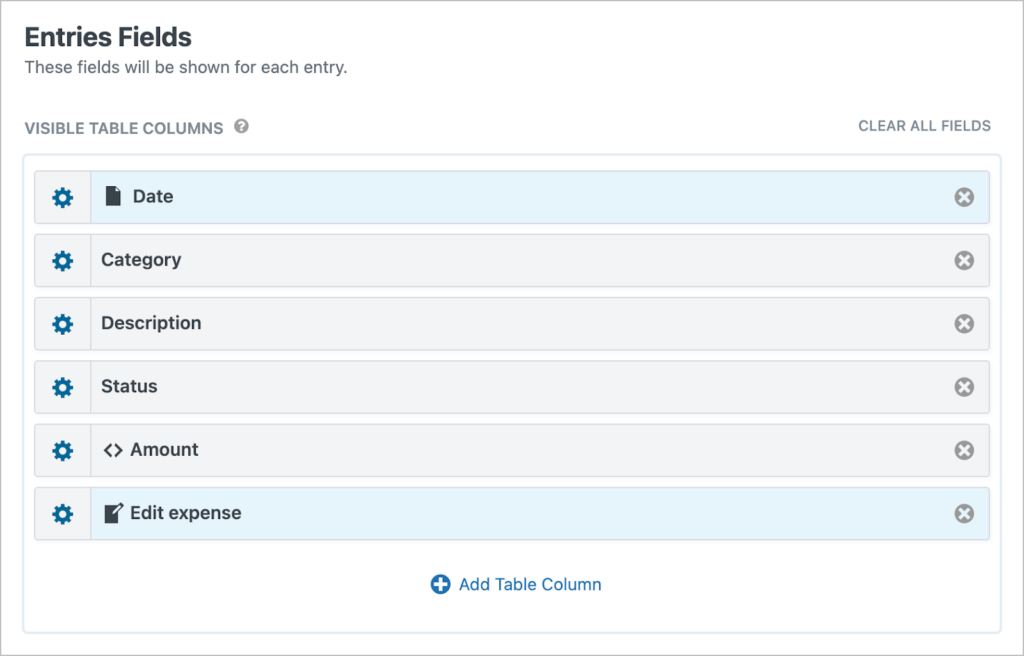
We can do this by scrolling down to the “Entries Fields” section and adding the various fields as table columns. Let’s add the Date, Category, Description, Status and Amount fields.
Finally, we’ll also add a “Link to Edit Entry” field (renamed to “Edit expense”) as this will enable our finance department up update the status of expenses directly from the front-end.
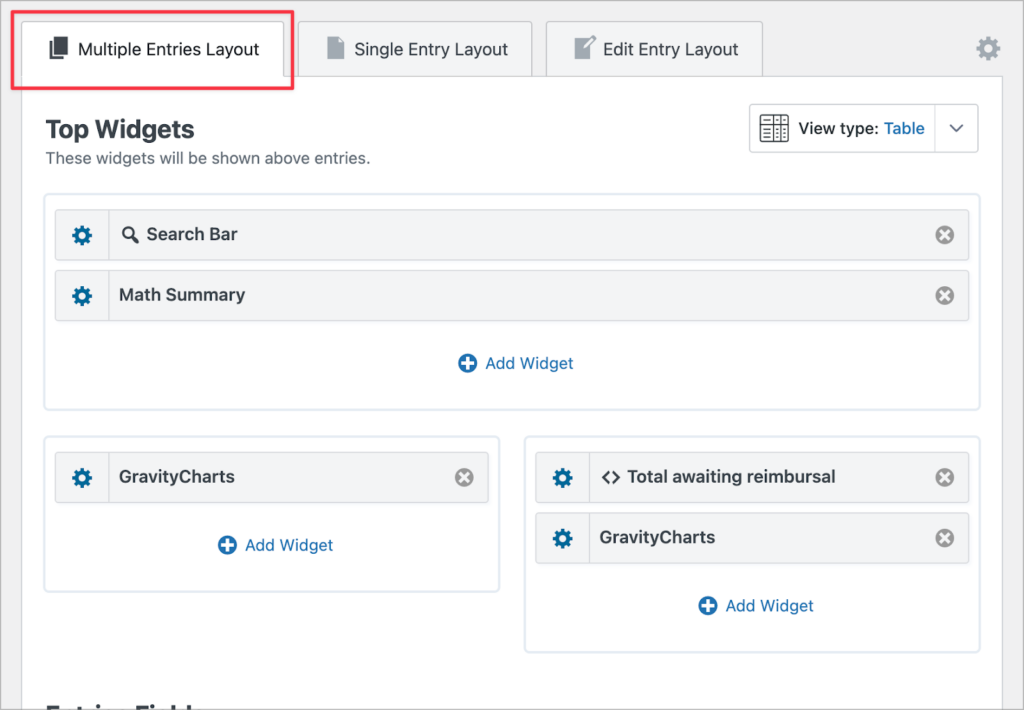
After adding the necessary fields to our View, we can turn our attention to widgets.
Adding widgets
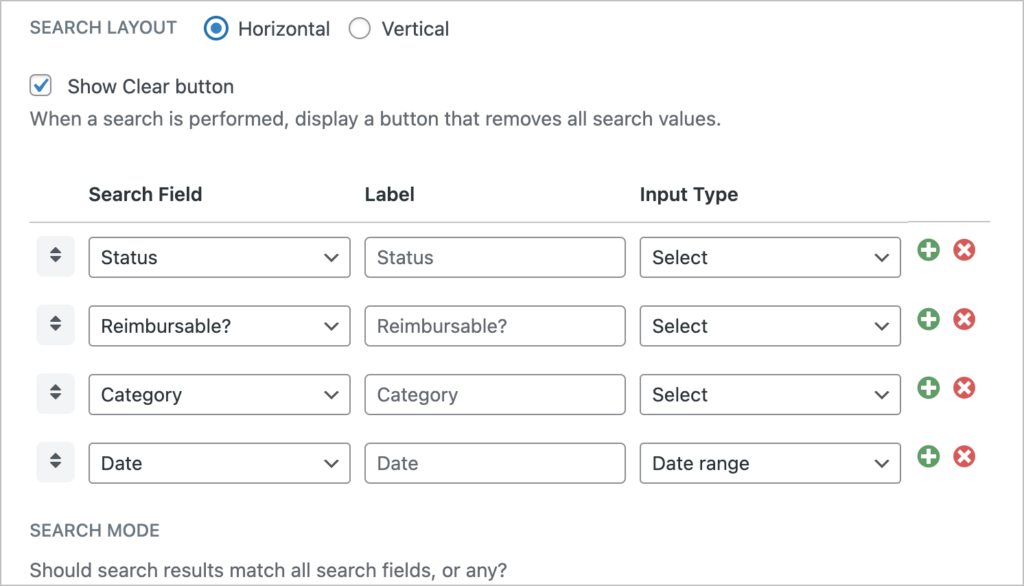
Let’s start by adding a search bar. This will enable users to filter expenses using various metrics. After adding the search bar widget, we can open the settings to configure the various search inputs.
Let’s add search inputs for status, category, date and whether or not the expense was marked as “reimbursable”.
Next, we’ll add a “Math Summary” widget. This will enable us to summarize our expense data by grouping them by common field values. In our example, we’ll group expenses by category and then display the sum of all expenses for each group.
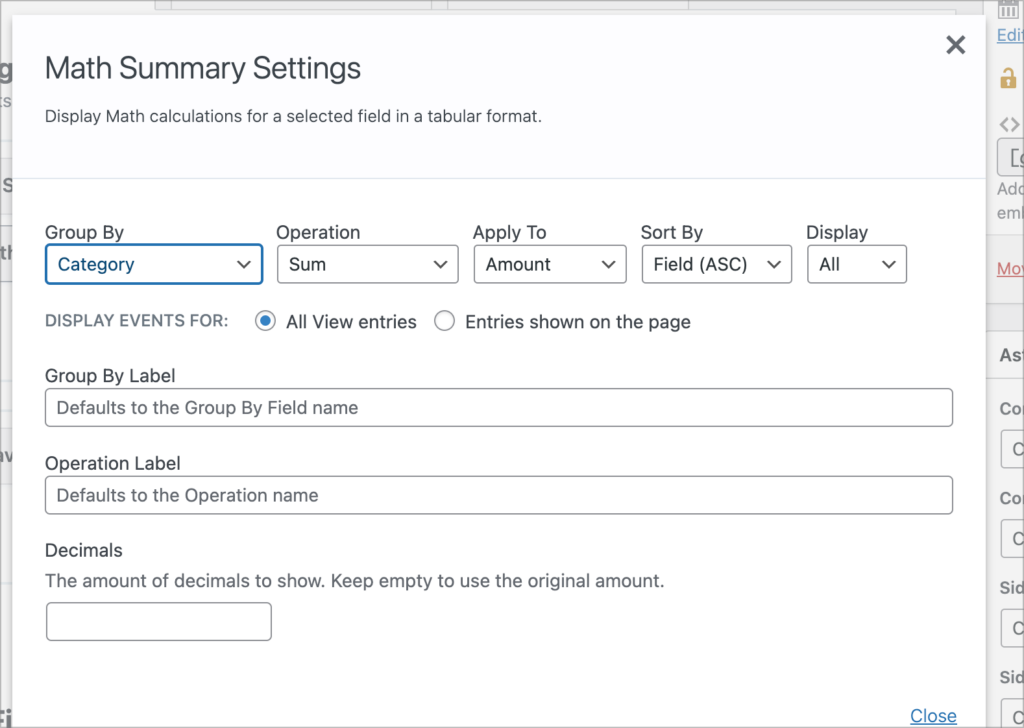
Pro tipLearn more about creating Summary Reports using GravityMath.
Finally, we’ll add our two charts! We can add these using the “GravityCharts widget”.
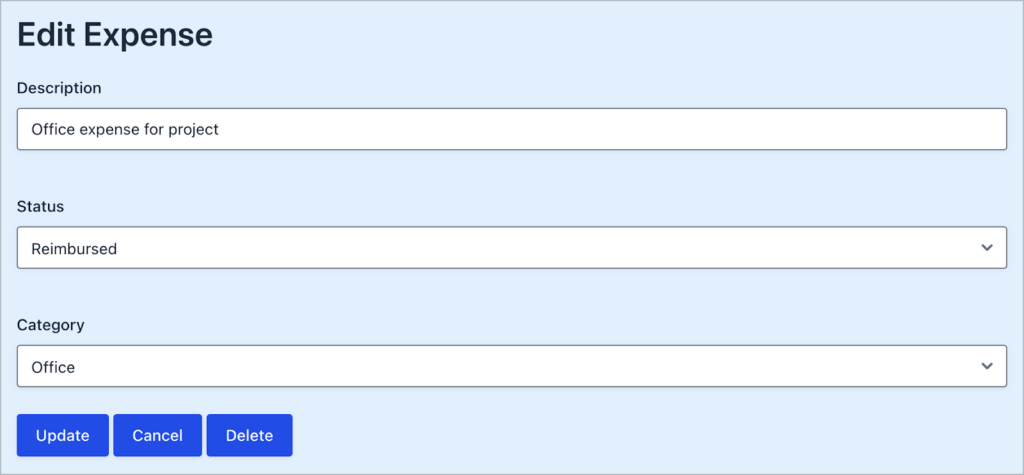
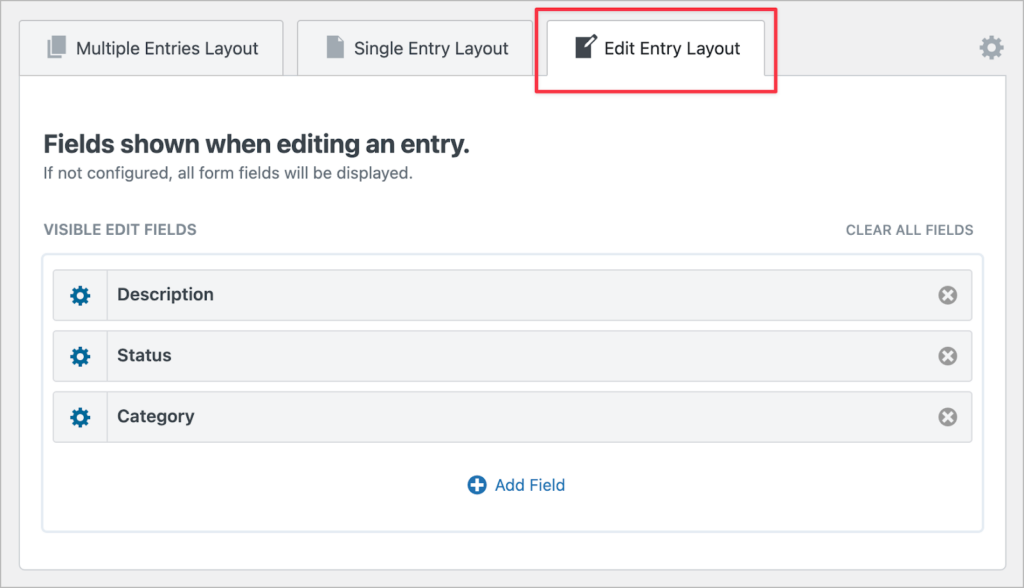
Configuring the Edit Entry layout
Next, we’ll configure the GravityView “Edit Entry” layout. Any fields we add here will be editable from the front-end.
That’s it! Here’s what our finished expense tracker looks like:
Clicking on the “Edit” link enables admins to update expense information. This is useful for updating the status of an expense once it’s been reimbursed or paid.

That’s it!
Build an expense tracker on WordPress today
In this tutorial, I showed you how to build an expense tracker on WordPress using Gravity Forms and GravityKit.
By following the steps outlined in this guide, you can create a dynamic and customizable expense management system tailored to your needs. Whether you’re tracking business expenses or managing a personal budget, GravityKit has you covered.
So what are you waiting for? Give GravityKit a try today!

Helpful tips right in your inbox.
Subscribe to get the latest articles, information on releases and helpful Gravity Forms tips!
More articles

10 things you can ask AI to do with Gravity Forms (using the free GravityKit MCP)
See 10 practical things you can ask AI to do with Gravity Forms using the free GravityKit MCP: create forms, manage entries, build Views, and more.

Launch Log: theme template editing in Block MCP, Shield silentCAPTCHA for Zero Spam, and GravityView fixes
Block MCP adds safe theme template editing, Gravity Forms Zero Spam gains Shield silentCAPTCHA support, and GravityView fixes lightbox and notice bugs.

GravityKit turns 12: a year in review, and 30% off Lifetime All Access
GravityKit turns 12. A look back at a year of GravityView 3.0, GravitySearch, and AI-assisted building, plus a birthday sale on the Lifetime All Access Pass.