Published
•
Updated
Introducing Image Charts for GravityCharts
We’re excited to announce the release of Image Charts, a new GravityCharts beta feature: you can now save your GravityCharts visualizations as static images! Saving your charts as static images allows you to embed them inside Gravity Forms notification emails and PDF reports generated...
We’re excited to announce the release of Image Charts, a new GravityCharts beta feature: you can now save your GravityCharts visualizations as static images!
Saving your charts as static images allows you to embed them inside Gravity Forms notification emails and PDF reports generated by Gravity PDF! Keep reading to learn more about this powerful new feature.
What Can You Do With Image Charts?
Images have an obvious advantage over dynamic charts: images can be included anywhere!
Being able to save your charts as static images opens up new ways for you to create reports and share data with other users. You can embed your chart images into:
- A WordPress post/page
- A Gravity Forms email notification
- A Gravity Forms confirmation message
- A PDF report generated by Gravity PDF
This allows you to create versatile data reports with embedded image files that can be saved and shared. However, one thing that’s important to note is that images of charts represent the chart data at the time the image was generated. If the data changes, the image will not update.
Saving Charts as Static Images
The new Image Charts feature is powered by QuickChart.io, a powerful, open source chart rendering API. When you choose to embed your chart as an image, QuickChart will generate a PNG file for you.
Here are all the different ways to embed charts as images:
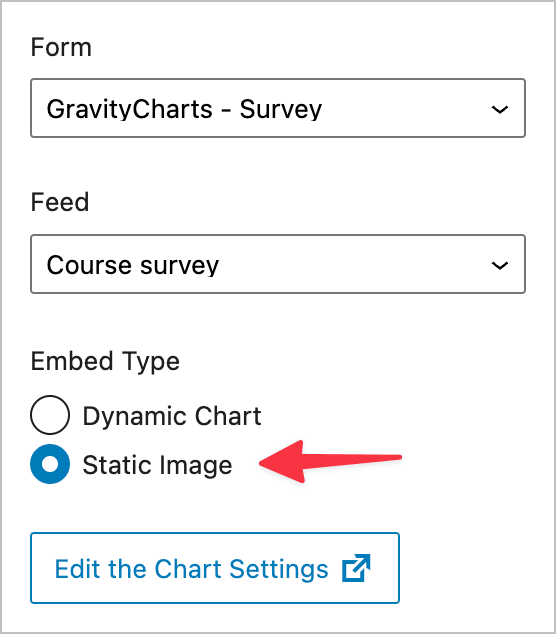
Using the GravityCharts Block
If you’re using the GravityCharts block to add a new chart to a page or post in WordPress, you’ll see a new option allowing you to select whether to embed a dynamic chart or static image.
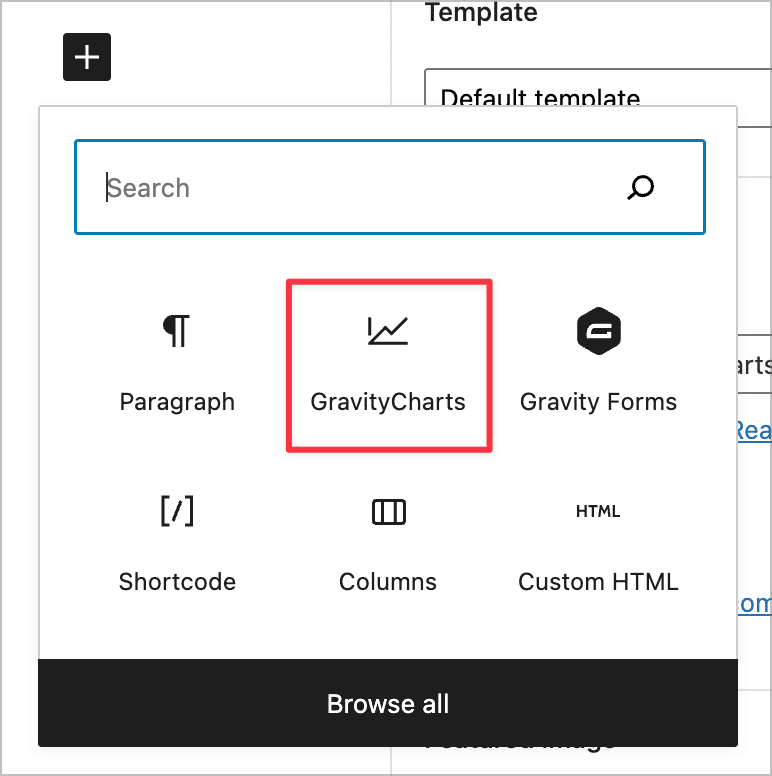
After adding the block to your page, navigate to the block settings. Here, you’ll see the option to either embed a dynamic chart (i.e., a chart that updates as you receive new data) or a static image (an image representing the data at the time it was generated).
Using the Shortcode
You can also embed your charts as images by using the [[gravitycharts]] shortcode and setting the embed_type parameter to image. Here’s an example:
[gravitycharts id="5" embed_type="image"]The default size of all chart images is 500px by 250px, but you can override this using the width and height shortcode parameters. You can use the [[gravitycharts]] shortcode anywhere on your website!
Using the Merge Tag
The final way to save GravityCharts visualization as image files is by using the new {gravitycharts} merge tag. If you’re not familiar with merge tags, they’re a feature of Gravity Forms that allow you to display dynamic content. (You can learn more about them here).
The structure of the merge tag is as follows:
{gravitycharts:[feed id]:[shortcode attributes]}Here’s an example:
{gravitycharts:5:width=500&height=250}Merge tags can be used in Gravity Forms notifications and confirmations.
Save Your GravityCharts Visualizations as Static Images
Image Charts is a new feature of GravityCharts that allows you to embed your visualizations as static PNG images. This allows you to embed charts in emails and PDFs generated by Gravity PDF!
We hope you’re as excited about this new feature as we are! For more information about the new Image Charts feature, check out the GravityCharts documentation.

Helpful tips right in your inbox.
Subscribe to get the latest articles, information on releases and helpful Gravity Forms tips!
More articles

How to build a WordPress CRM without code (a contact database you own)
Build a simple WordPress CRM with GravityView. Turn the Gravity Forms entries you already collect into a no-code contact database you own, with no monthly fees.

Launch Log: Distance sorting for radius searches, DataTables search improvements, and import reliability fixes
The latest GravityKit releases add distance sorting to map searches, bring built-in search to DataTables, and fix GravityCharts and GravityImport edge cases.
WordPress page builder market share 2026: Elementor leads at 32.67%
Elementor reaches 32.7% of WordPress sites. WordPress Block Editor 20.6%, wpBakery 8.5%, Divi 5.7%. Latest HTTP Archive crawl, share-of-WordPress basis throughout.