
Published
•
Updated
Announcing GravityMath 2.5: New widget, block and shortcode for creating summary reports
GravityMath 2.5 introduces summary report widgets, blocks, and shortcodes that calculate totals, averages, and counts across grouped Gravity Forms entries on any page.


We’re excited to announce the release of GravityMath 2.5. This latest update includes a new block, shortcode and GravityView widget for creating summary reports from your form data.
Summary reports allow you to perform calculations across groups of form entries, helping you analyze data and generate insights in ways that matter to your business.
What are Summary Reports?
Summary reports enable you to analyze data grouped by predefined choices, making it easy to calculate totals, averages, counts, and more for each category.
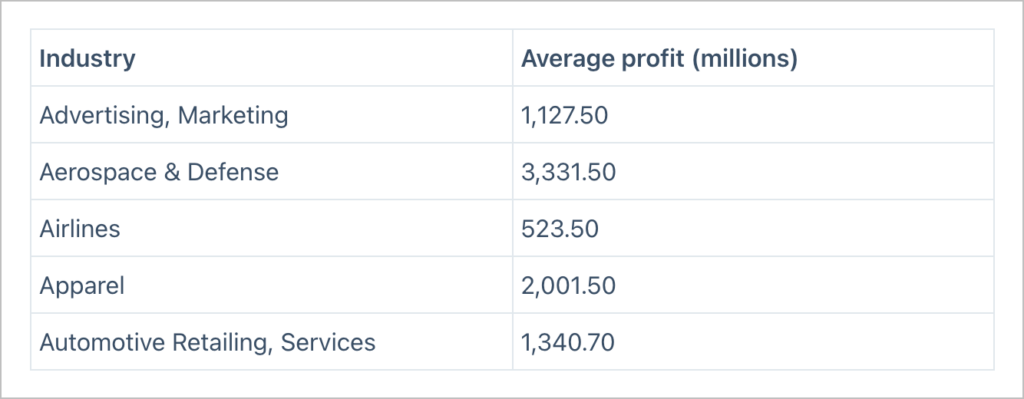
Here’s an example: Suppose we’re collecting data about company earnings in different industries. We could create a Summary Report that tells us the average revenue for companies in each industry.

How to configure Summary Reports
The best thing about Summary Reports? You can display them anywhere! Add Summary Reports to pages or posts using a shortcode or block, or add them to a View using a GravityView widget.
Using the Block
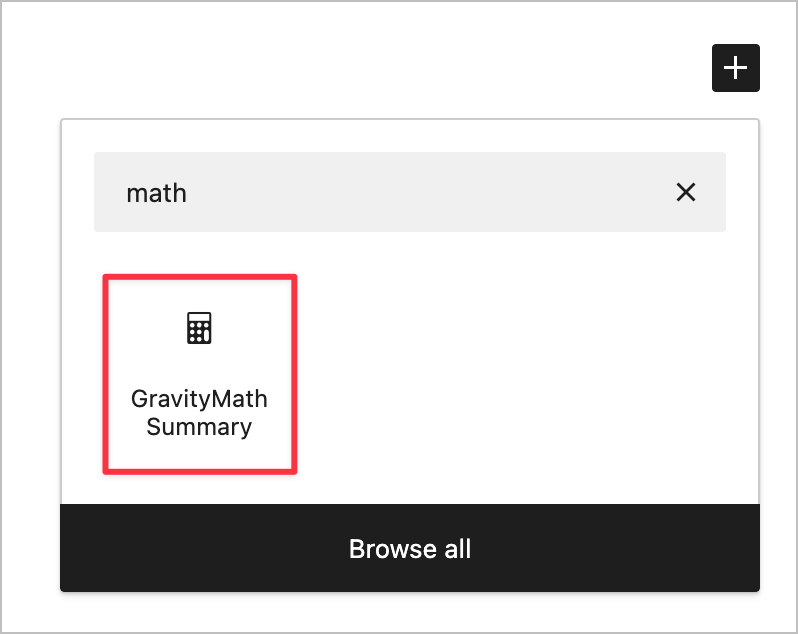
To create a new Summary Report, simply add the “GravityMath Summary” block to your page or post.
Next, open the block settings to configure the report. The first thing you’ll need to do is select a source for the data. This can either be an existing form on your site, or a View in GravityView.
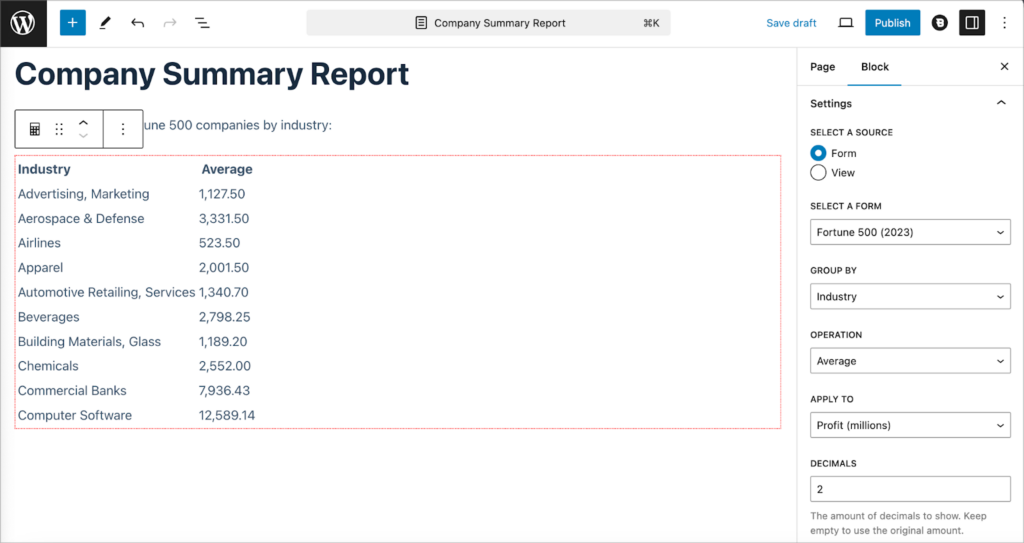
As you configure the report, the preview will update in real time. Here’s a list of the Summary Report parameters:
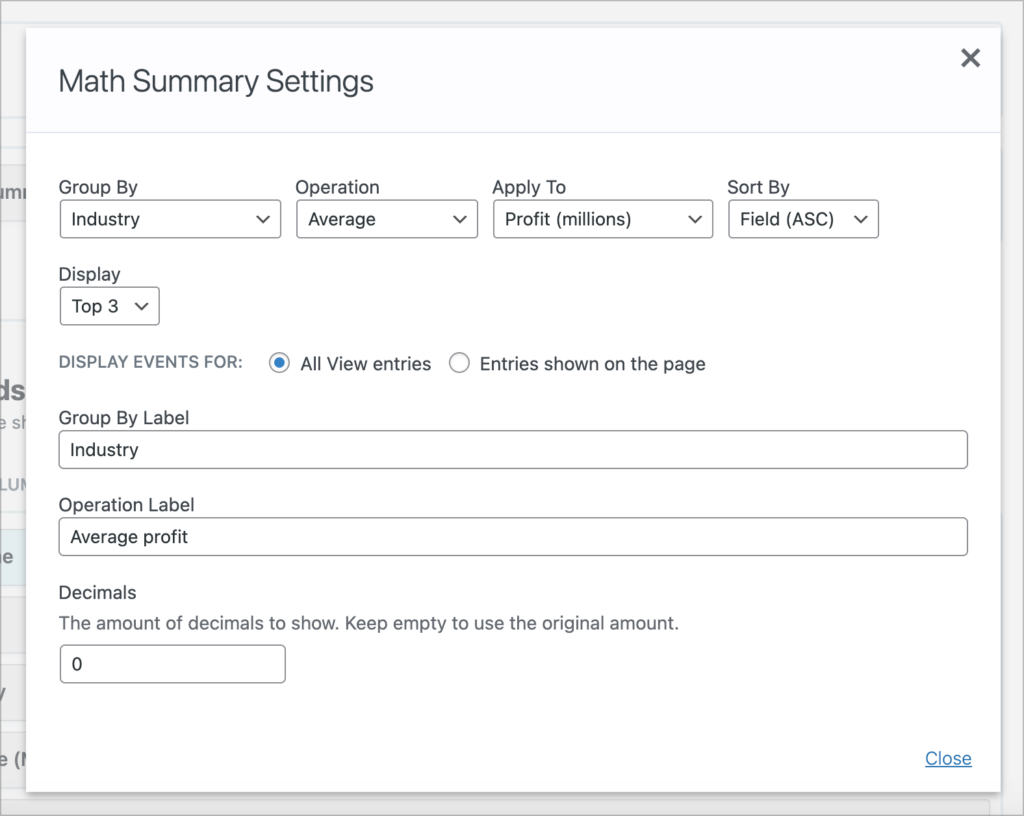
- Group by – The field you want to group entries by
- Operation – The mathematical operation to perform (either count, sum, average, max or min)
- Apply to – The field you want to perform the operation on
- Decimals – The number of decimal places for the output
- Sort by – Sort output ASC or DESC
- Display – The number of rows to display in the summary
- Group by label – The group by column title
- Operation label – The operation column title
💡 Pro tip: Learn more about creating Summary Reports using a block, shortcode, or widget.
Using the GravityView widget
To display a Summary Report that updates when you search or filter in a View, you can use the “Summary Report” widget in the View editor.
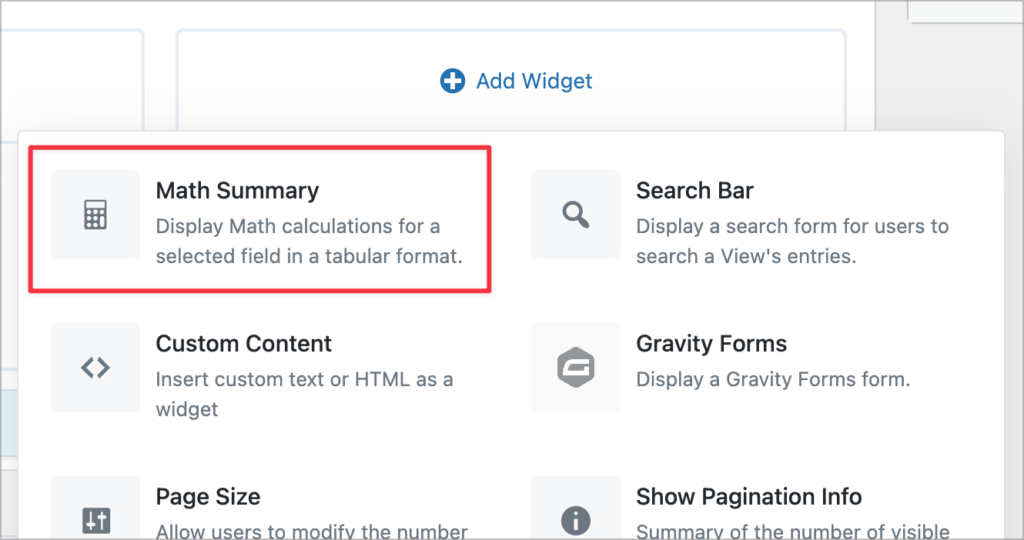
After adding the widget to your View, simply configure the parameters. There’s no need to select a data source as the report will only consider the entries in your View. That means it will also respect any advanced filtering conditions that you have applied.
The output of the report is a table containing the calculated values for the grouped data.
Take Summary Reports for a spin
With these new tools for creating Summary Reports in GravityMath 2.5, you can unlock deeper insights from your Gravity Forms data. We’re excited to continue delivering valuable features to our community while enhancing integration across our plugins.
Take advantage of this new functionality by updating your GravityMath plugin today!

Get better at Gravity Forms, one email a week
New GravityKit releases, practical Gravity Forms tutorials, and subscriber-only discounts. One short email every week, unsubscribe anytime.
More articles

Launch Log: A range slider for search, AI-managed calendars, and security updates in ten products
GravityView adds a Slider search input, GravityCalendar lets AI assistants manage calendars, and ten GravityKit products get security fixes. Here’s what shipped.

9 nonprofit apps you can build with Gravity Forms and GravityKit
Nine apps nonprofits build on WordPress from Gravity Forms data: volunteer databases, member directories, client portals, donation pages, grant review and more.
How to migrate from Fluent Forms to Gravity Forms without rebuilding your forms
Move your Fluent Forms forms into Gravity Forms with GravityMigrate, then bring your entries across with GravityImport. Every step was tested on the free version of Fluent Forms.