Published
•
Updated
How we replaced the Google Analytics “Annotations” feature using Gravity Forms and GravityView
Google Analytics 4 dropped annotations. See how GravityKit rebuilt the feature using Gravity Forms and GravityView to log website changes and marketing events on a timeline.
In the ever-changing world of web analytics, being adaptable is super important.
We were big fans of the annotations feature in the old Google Analytics (you know, the Universal Analytics era). But when we made the leap to Google Analytics 4, guess what? That feature was nowhere to be found!
Annotations were like digital sticky notes for web analytics. They allowed users to add comments and markers to specific dates on the timeline of their reports.
Annotations were helpful for keeping track of website changes or marketing initiatives and seeing how traffic/conversions changed as a result. When we launched new marketing campaigns, or made significant changes to our website or servers, we would record that change using an annotation. This allowed us to quickly debug issues or revert changes if we saw traffic or conversions begin to drop.
Having relied on annotations for years, and suddenly finding ourselves without them, we needed a solution!
That’s when we thought, “Hey, this seems like something Gravity Forms plugins should be able to solve!” And just like that, we kicked off a mission to create annotated analytics reports using our own tools.
What was the end result, you ask? A customizable dashboard loaded with insights and annotations, all neatly packed onto a single page!

Keep reading to see how we built it—step by step.
Architecting a solution
We knew we could create annotations using Gravity Forms and display them using GravityView. Using GravityView would also allow us to edit and update annotations directly from the front-end.
However, we needed a way to combine annotations with our web analytics data in Google Analytics. Then it hit us: we could combine data from multiple sources by creating a custom Looker Studio report!
We just needed a way to send annotations from Gravity Forms to Google Sheets so that we could feed them into our report. That’s when we remembered that our friends over at Gravity Wiz have a handy little perk that does exactly that.
Using these tools would allow us to create a dashboard where we could visualize our web analytics data, as well as add, update, delete and export annotations—all without leaving the page!
Assembling the required plugins
Here are the plugins we used to build our dashboard:
- Gravity Forms
- GravityView
- GravityCalendar
- GravityExport (optional)
- GP Google Sheets by Gravity Wiz
The beautiful thing about the Gravity Forms ecosystem is that it can handle almost any use case—there is always a plugin to help you solve whatever issue you’re battling with at the time.
Using Gravity Forms to record new annotations
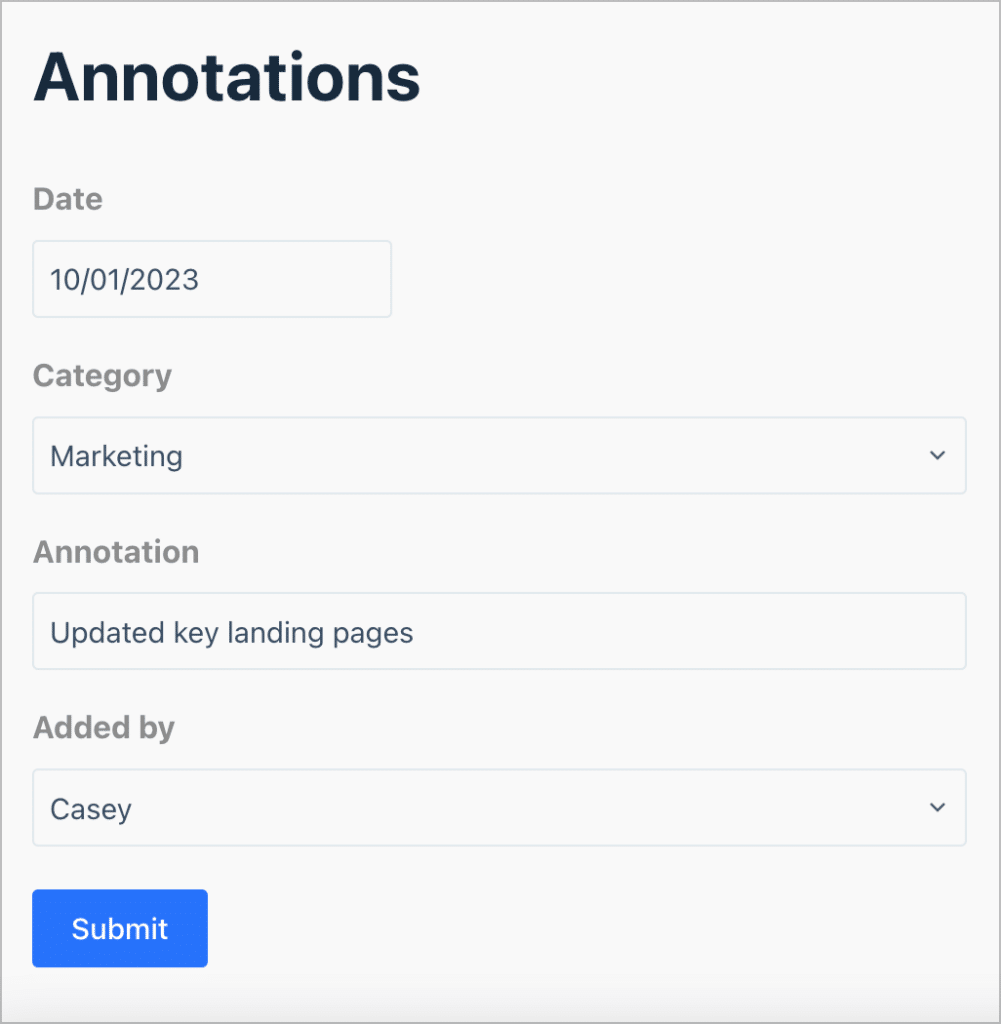
The first step was to create a simple form for adding new annotations. To do this, we created a Gravity Form with the following fields:
- Date (Date field)
- Category (Drop Down field)
- Annotation (Single Line Text field)
- Added By (Drop Down field)
The “Date” field is important for knowing when the change occurred and matching the annotation to our GA data. The “Category” field allows us to categorize annotations into one of three categories—”Marketing”, “Website”, or “Server updates”.
Next, we needed to send that data to Google Sheets so we could combine it with our Google Analytics data.
Sending new annotations to a Google Sheet
To do this, we used a Gravity Wiz Perk. Their powerful GP Google Sheets adds a new feed to Gravity Forms, allowing you to send form entry data to a spreadsheet of your choosing.
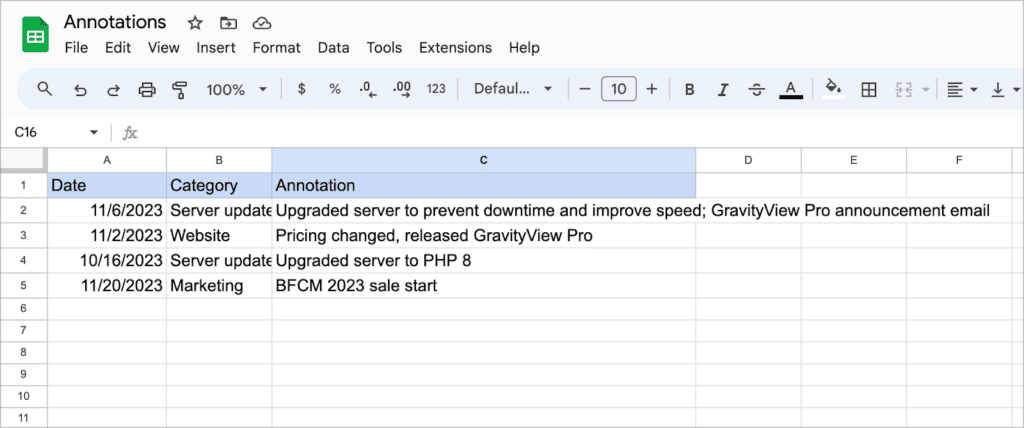
After creating a new spreadsheet called “Annotations”, we set up a feed to ensure that newly submitted annotations would automatically show up in our spreadsheet.
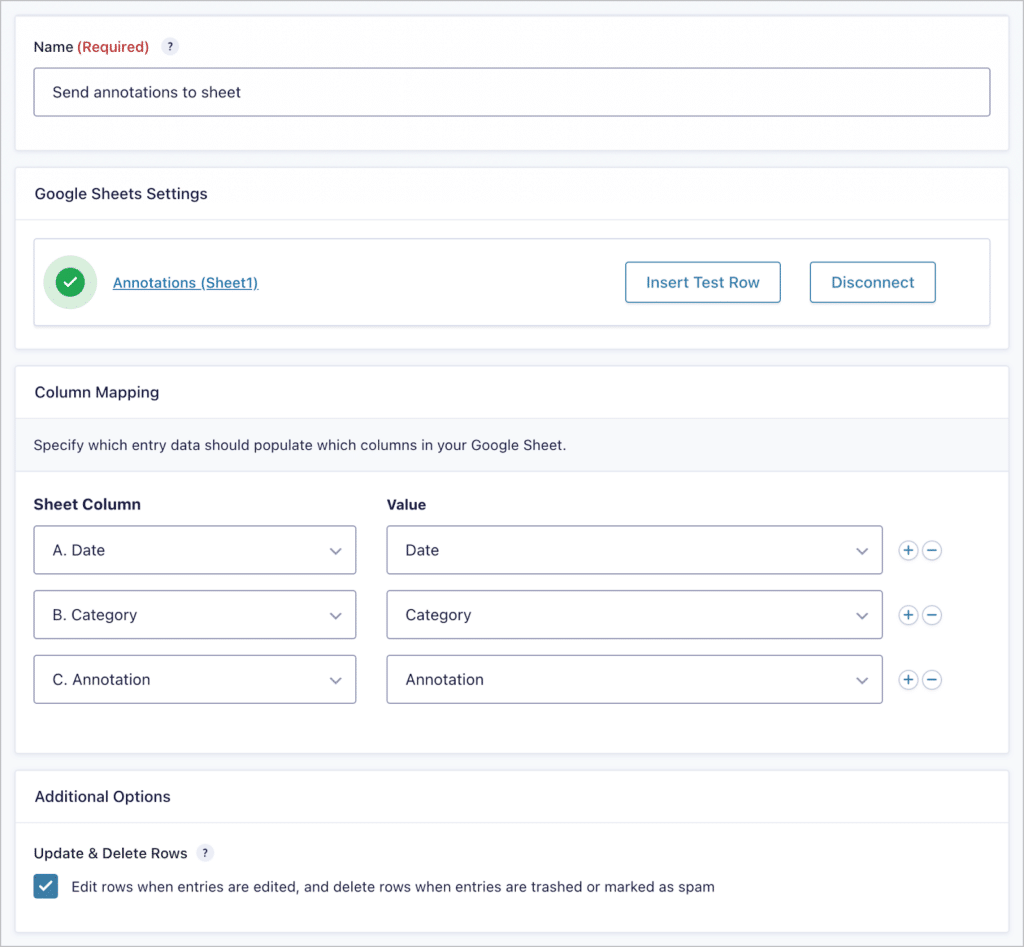
After submitting a few annotations through our form, we saw our spreadsheet update almost instantly.
Configuring the feed only took us a few minutes! Next, we turned our attention to combining our annotation data with our Google Analytics data in Looker Studio.
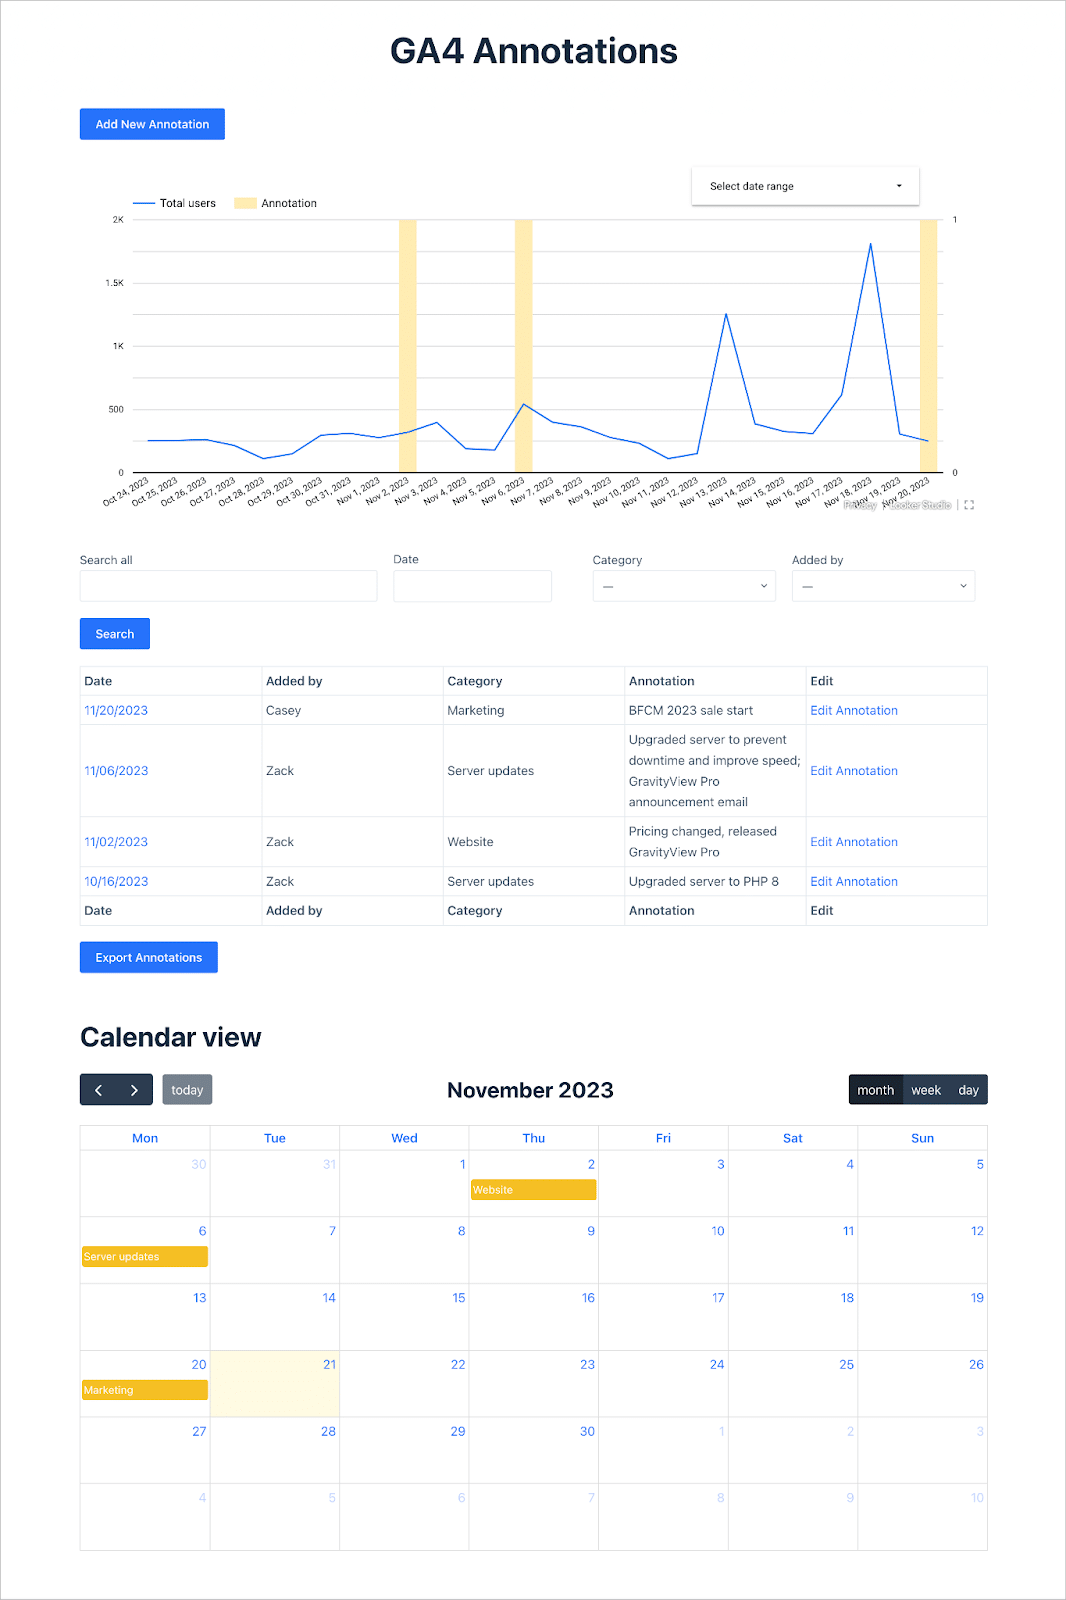
Combining annotations with Google Analytics data using Looker Studio
For those of you not familiar with Looker Studio, it’s a free tool provided by Google that enables you to convert data into customizable reports.
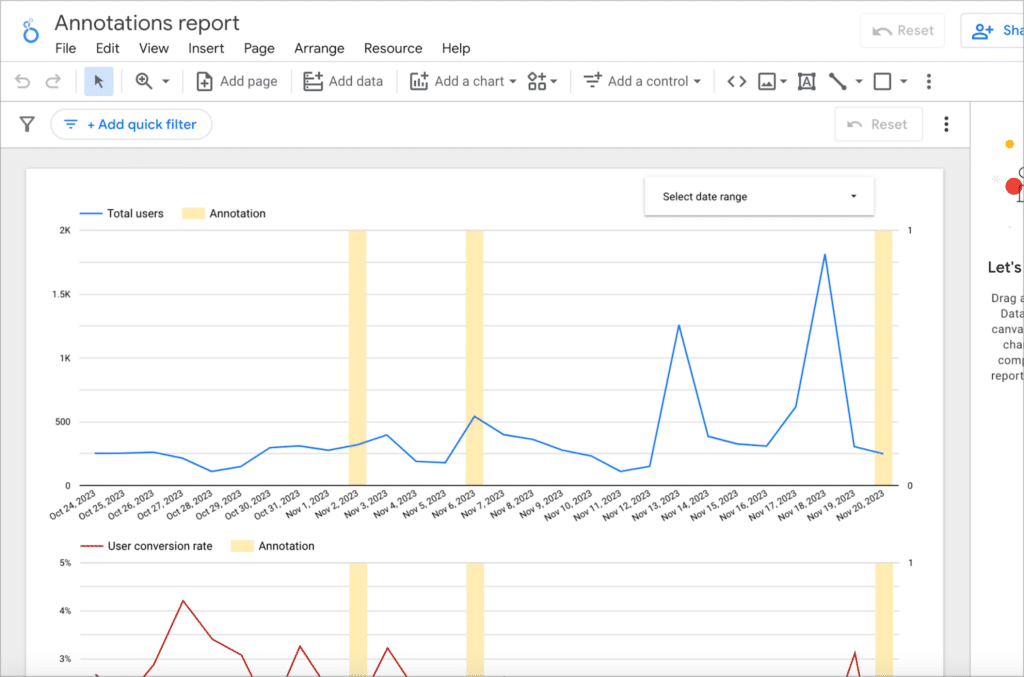
A powerful feature of Looker Studio is the ability to create “blends” by retrieving data from different sources and joining it together on a common field value. We used this to create a blend of our Google Analytics 4 data and our annotation data in Google Sheets.
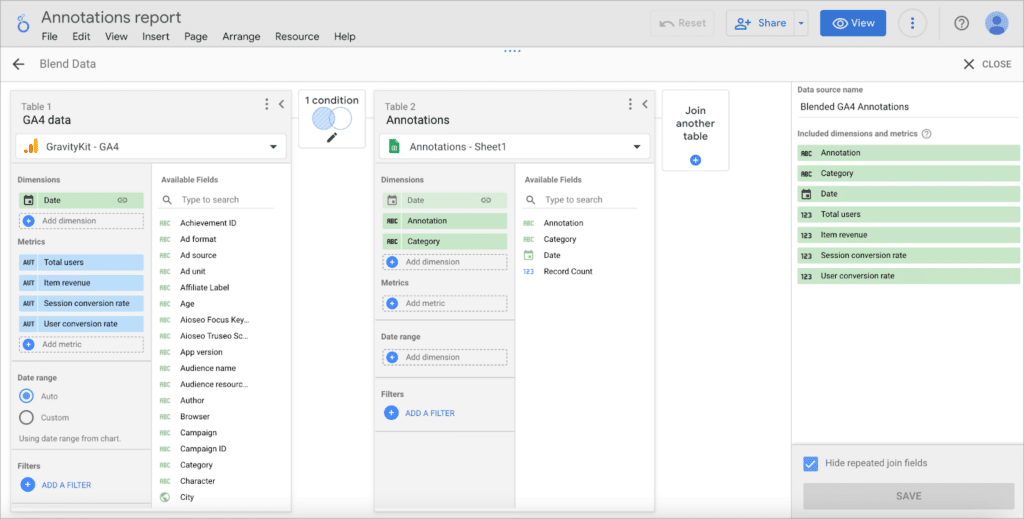
This new blended data source allowed us to create customized reports showing website traffic, conversions, or sales (the blue line) per day with annotations overlaid (the yellow bars).
Now all we needed to do was put the finishing touches on our dashboard by showcasing annotation data using GravityView.
Displaying annotations using GravityView
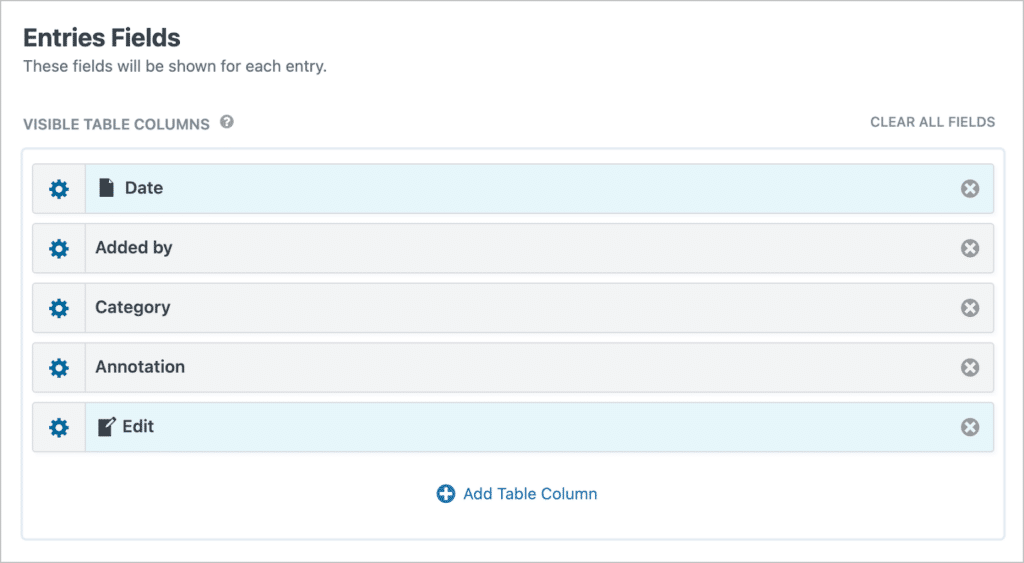
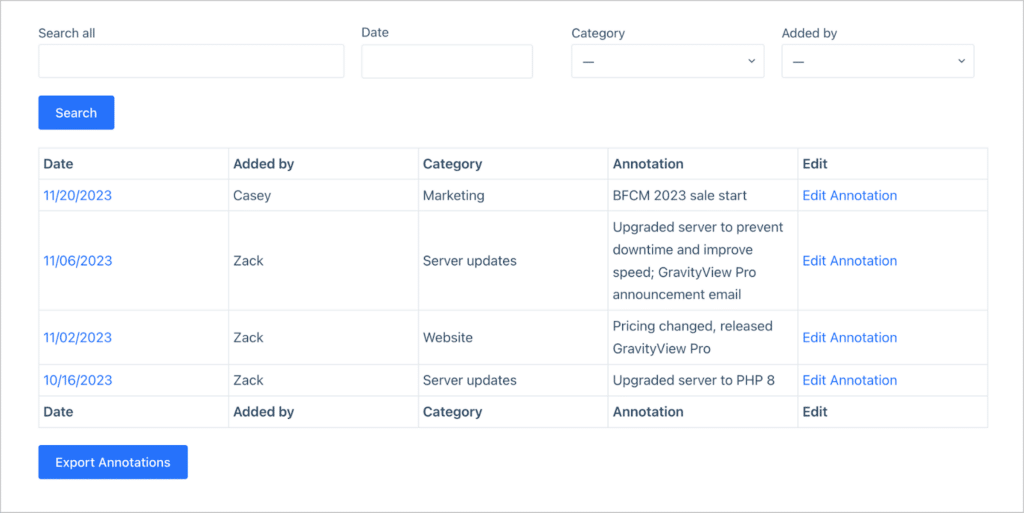
We created a new View and selected “Table” as the View Type. We then added our form fields to the “Entries Fields” section. Here, we also added a link to the Edit Entry page, giving us an easy way to update annotations from the front end.
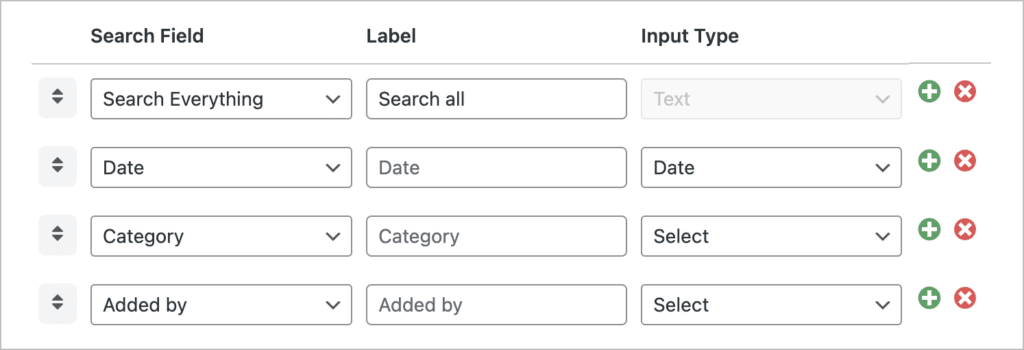
We then added a search bar widget to the top. This gave us a way to filter annotations by date, category, keyword, or user.
Finally, we added a sort condition in the view settings to ensure that new annotations appeared at the top.
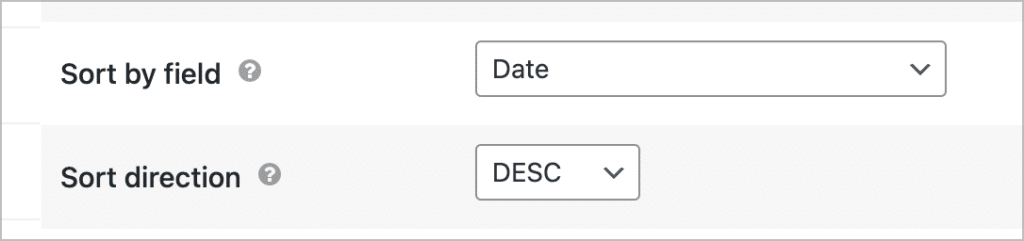
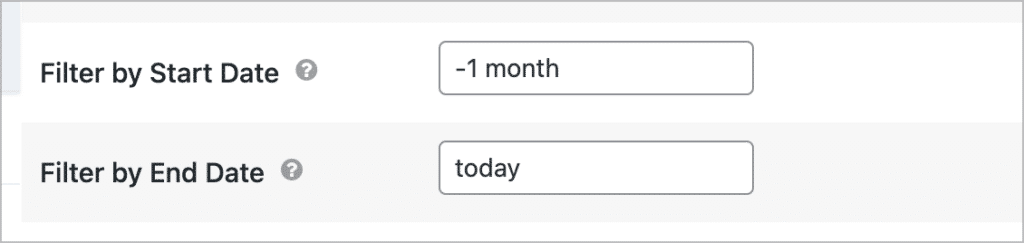
We also added a filter to only display annotations added in the last month.
Adding the ability to export annotations
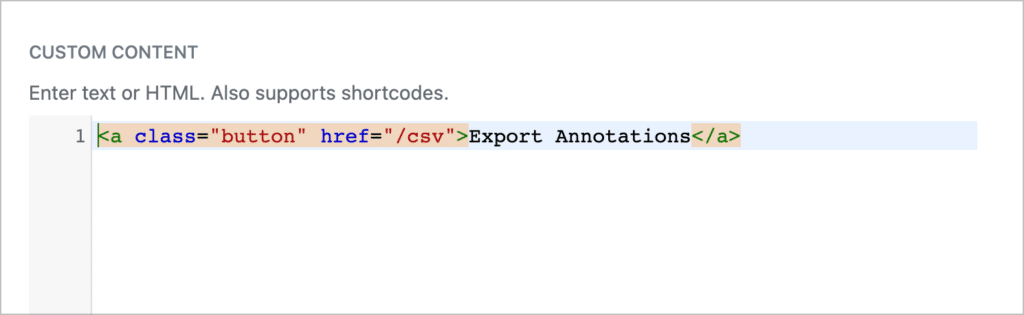
It’s always useful having the ability to export annotations, so we added a button to export annotations to CSV at the bottom of our View.
GravityView has a built-in export feature, allowing you to export View data to CSV format by adding /csv to the end of the View URL. To create an export button, all we did was add an HTML anchor link inside a Custom Content field!
Here’s our finished View with the “Export Annotations” button at the bottom:
Adding a calendar to show annotations by date
Using GravityCalendar, we created a calendar that displays our annotation data. While the calendar doesn’t offer any unique functionality over the View in this case, it does give us another high-level way to see when important website changes occurred.
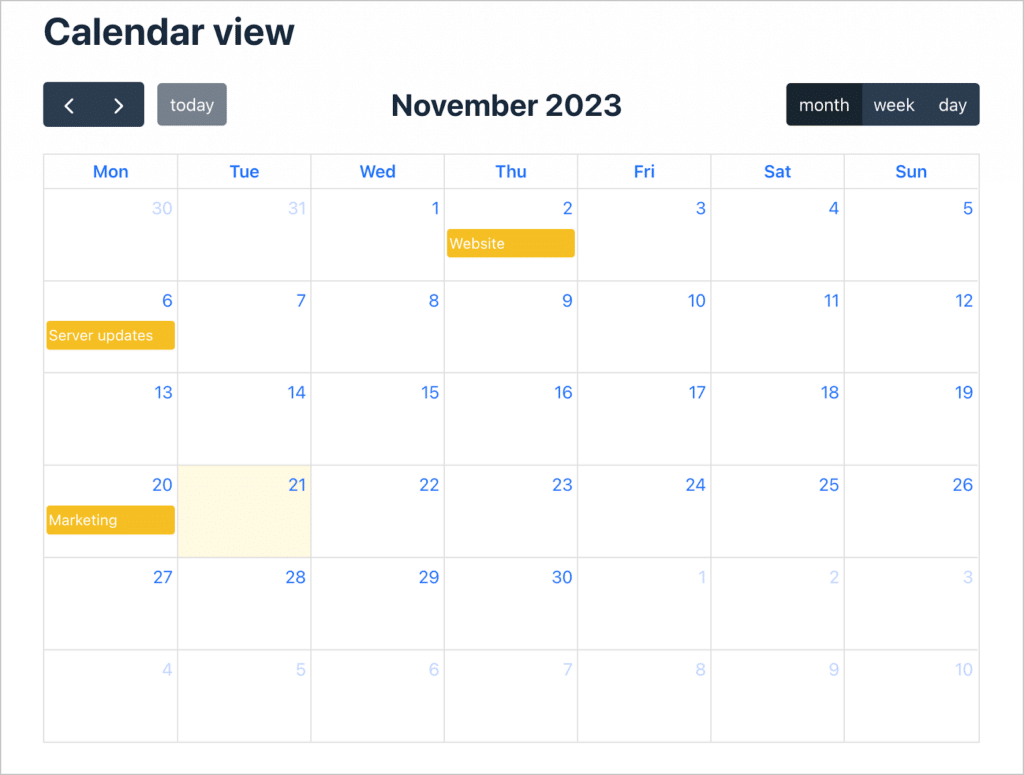
💡 Pro tip: Learn more about displaying Gravity Forms entries on a calendar for events and other use cases.
That’s it!
The result: A powerful analytics dashboard for our marketing team
Having this dashboard enables our team to submit, visualize, and update annotations all from the front end of our site without ever needing to visit Google Analytics!
This gives our team an easy way to record changes they make to our website or servers so we can track the impact of those changes on traffic, conversions and other important metrics.
That’s it!
The power of the Gravity Forms ecosystem
When we transitioned to the new Google Analytics 4, we found they had gotten rid of our favorite feature: annotations! Using a bit of creativity, we were able to recreate this feature using Gravity Forms plugins.
The dashboard we built isn’t just a solution to a problem; it’s a testament to the effectiveness of having a toolkit that can be used to craft a diverse range of solutions. When it comes to solving real problems, the Gravity Forms ecosystem of plugins continues to be the ultimate game-changer!
For agencies and freelancers, the ease of integration among the Gravity Forms ecosystem of plugins speaks volumes. If you’re looking to build powerful web apps using a well-integrated set of tools, check out GravityKit today!

Helpful tips right in your inbox.
Subscribe to get the latest articles, information on releases and helpful Gravity Forms tips!
More articles
10 things you can ask AI to do with Gravity Forms (using the free GravityKit MCP)
See 10 practical things you can ask AI to do with Gravity Forms using the free GravityKit MCP: create forms, manage entries, build Views, and more.

Launch Log: theme template editing in Block MCP, Shield silentCAPTCHA for Zero Spam, and GravityView fixes
Block MCP adds safe theme template editing, Gravity Forms Zero Spam gains Shield silentCAPTCHA support, and GravityView fixes lightbox and notice bugs.

GravityKit turns 12: a year in review, and 30% off Lifetime All Access
GravityKit turns 12. A look back at a year of GravityView 3.0, GravitySearch, and AI-assisted building, plus a birthday sale on the Lifetime All Access Pass.